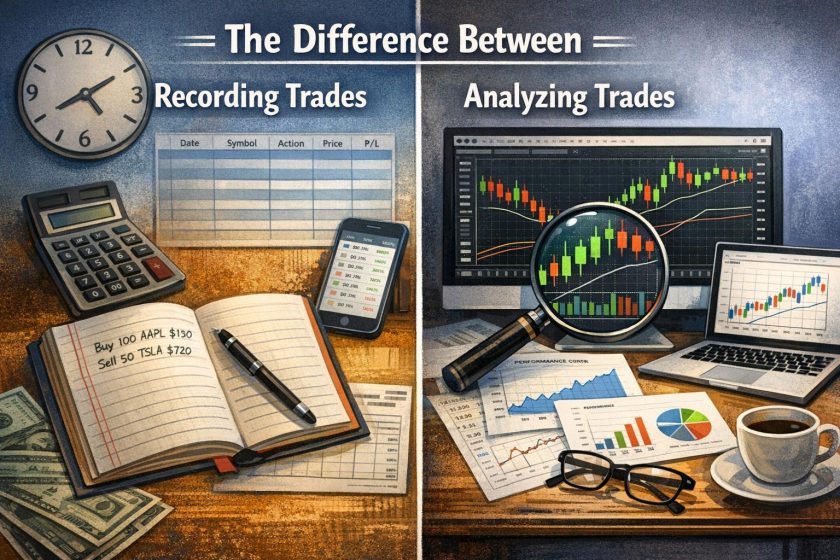
Understanding the Distinction Between Recording and Analyzing Trades
In the realm of trading, two fundamental activities often become intertwined in practice: recording trades and analyzing trades. Although closely connected, they serve distinct purposes within a trader’s development and operational framework. Recording trades focuses on the structured documentation of transactional data, while analyzing trades centers on interpreting that data to refine decision-making and improve performance. Confusion between these processes can hinder a trader’s growth, as each requires a different mindset, set of tools, and level of engagement.
A clear understanding of how recording and analysis differ—and how they complement one another—creates a foundation for disciplined and systematic trading. The distinction is not merely procedural; it reflects two separate stages in a feedback cycle that supports consistency, accountability, and strategic evolution.
Recording Trades
Recording trades refers to the consistent documentation of every executed transaction. The process is primarily administrative, yet it forms the structural backbone of a professional trading approach. When traders record trades carefully, they build a comprehensive dataset that enables objective review at a later stage.
A properly maintained trading journal generally includes factual information such as the date and time of entry and exit, the asset or instrument traded, the position size, the entry and exit prices, the stop-loss and take-profit levels if applicable, and the final outcome expressed in profit, loss, or percentage return. Additional contextual details may also be included, such as prevailing market conditions, the strategy used, timeframe alignment, or any deviations from a predefined trading plan. Some traders also note subjective observations, including confidence levels or perceived external influences.
The key characteristic of recording is neutrality. At this stage, the trader does not interpret, justify, or critique decisions. The goal is to capture what occurred, not to explain why it happened or whether it was effective. This distinction is essential because introducing interpretation during recording may compromise objectivity. The journal serves as raw data, and its reliability depends on accurate, consistent, and timely entries.
Another defining element of effective trade recording is standardization. When the same format is used for every trade, comparison across time becomes feasible. Uniform data fields allow for pattern recognition during the analysis phase. Inconsistent or incomplete records limit the ability to draw meaningful conclusions later.
Timing also matters. Trade details should be recorded immediately after execution or closure. Delayed entry increases the risk of missing information or distorting details due to memory bias. In fast-moving markets, relying on recollection even a few hours later can reduce accuracy.
The Importance of Consistent Trade Recording
Consistency in recording trades is not optional for traders who aim to improve systematically. A comprehensive record establishes accountability and acts as a performance archive. Over weeks, months, and years, this archive grows into a personal dataset reflecting real behavior under live conditions.
Without consistent documentation, traders are limited to selective memory. Human recall often emphasizes recent outcomes or especially favorable results, which can distort perception. Recording every trade, regardless of outcome, prevents selective bias from influencing future decisions.
Trade recording also provides transparency. In professional settings, such as proprietary trading firms or managed accounts, maintaining thorough records is part of compliance and performance evaluation protocols. Even independent traders benefit from this transparency because it enables objective self-assessment.
Furthermore, consistent logs allow for performance benchmarking. Traders can compare different time periods, strategies, asset classes, or market conditions. For example, they may discover that performance is stronger during trending environments than during range-bound markets. However, this insight becomes available only if relevant data points were captured at the recording stage.
Another advantage lies in identifying deviations from a trading plan. By documenting the specific setup or strategy used in each trade, it becomes possible to measure adherence to rules. If rule-breaking occurs frequently, the data will reveal it. Without such records, it may be difficult to determine whether underperformance stems from strategy limitations or inconsistent execution.
It is important to note that recording trades is not inherently analytical. While a trader might briefly note subjective observations, these entries remain descriptive rather than evaluative. Their true value emerges during the next stage: analysis.
Analyzing Trades
In contrast to recording, analyzing trades involves interpreting the collected data to identify strengths, weaknesses, patterns, and structural tendencies within a trading approach. Analysis transforms raw transactional records into actionable insights.
Where recording answers the question “What happened?”, analysis asks “Why did it happen?” and “What does it imply?” This shift represents a move from documentation to evaluation.
Trade analysis often begins with calculating performance metrics. These may include win rates, average gain versus average loss, expectancy, drawdown levels, risk-to-reward ratios, and overall profitability. However, analysis extends beyond numeric summaries. It also involves examining trade selection, timing accuracy, market context, and psychological consistency.
One of the primary purposes of analysis is to determine whether a strategy has a positive expectancy over a statistically meaningful sample size. Individual trades have limited informational value; patterns across dozens or hundreds of trades reveal structural characteristics. By evaluating aggregated data, traders can determine whether a method produces consistent returns relative to risk.
Another dimension of analysis concerns risk management. Even profitable strategies can underperform if position sizing is inconsistent or if risk exposure exceeds predefined limits. Through reviewing multiple trades, a trader may discover, for instance, that losses escalate when deviating from predefined stop-loss rules or when increasing trade size during periods of volatility.
Psychological factors also become visible during analysis. Patterns such as premature exits, hesitation in executing valid setups, or impulsive entries outside of strategy parameters can be identified only after systematic review. Recording makes these behaviors visible; analysis interprets their consequences.
Key Aspects of Trade Analysis
Trade analysis generally examines both quantitative and qualitative aspects of performance. Quantitative evaluation focuses on data aggregation and measurement. This includes calculating risk-adjusted returns, determining consistency across timeframes, and assessing variance in results. By comparing these metrics against defined benchmarks, traders can measure progress objectively.
Qualitative analysis evaluates decision-making processes. This involves reviewing screenshots of charts at entry and exit points, assessing alignment with predefined criteria, and examining contextual factors such as broader market trends or macroeconomic events. While quantitative metrics reveal outcomes, qualitative evaluation reveals process integrity.
Another important aspect is segmentation. Traders often analyze trades according to categories such as asset class, time of day, volatility conditions, or strategy type. Segmenting data enables more precise insights. For example, a trader may find that a breakout strategy performs well in high-volume sessions but underperforms during low-liquidity periods. Without segmented analysis, such patterns may remain concealed within aggregate results.
The evaluation of win/loss ratios must also be contextualized. A high win rate does not necessarily indicate profitability if average losses exceed average gains. Conversely, a lower win rate strategy may remain profitable if gains significantly outweigh losses. Analysis clarifies these relationships through statistical measurement rather than intuition.
Risk concentration is another focal point. Reviewing consecutive losses, drawdown periods, and maximum exposure levels allows traders to assess whether their capital allocation model supports long-term sustainability. This stage often leads to adjustments in position sizing or diversification.
Importantly, analysis should occur at predefined intervals rather than impulsively after each trade. Reviewing too frequently may prompt premature modifications to a system that requires a larger sample to demonstrate validity. Structured review cycles—such as weekly or monthly evaluations—encourage disciplined assessment.
The Role of Technology in Trade Analysis
Modern trading environments provide substantial technological support for both recording and analyzing trades. Many brokerage platforms automatically log executed transactions, reducing the manual burden of data entry. However, automated records alone are often insufficient for comprehensive analysis. Traders may need to export data into specialized software or custom spreadsheets to calculate advanced metrics.
Data visualization tools contribute significantly to analytical clarity. Equity curves, drawdown charts, distribution graphs of returns, and expectancy models help translate abstract numbers into interpretable patterns. Visualization reduces cognitive load and facilitates comparative analysis across time periods.
Algorithmic tools can further enhance analysis by backtesting strategies on historical data. Backtesting complements forward-recorded results, offering insight into how a strategy might perform under varied market conditions. Nevertheless, backtested outcomes should be interpreted cautiously and compared against live-trading records to assess consistency.
Some platforms integrate tagging systems that allow traders to label trades according to setup type or market condition. These categorizations streamline segmented analysis. For example, filtering trades by a specific tag can instantly reveal average performance metrics for that subset.
Artificial intelligence and machine learning applications are increasingly capable of identifying correlations across large datasets. While such tools offer advanced capabilities, their effectiveness depends on the quality and completeness of recorded data. Inaccurate or inconsistent logs limit analytical reliability, regardless of technological sophistication.
Despite these advancements, technology does not replace critical thinking. Analytical outputs must be interpreted within the context of a trader’s objectives, risk tolerance, and strategic framework. Automated metrics provide information, but strategic refinement requires informed judgment.
Integrating Recording and Analysis into a Structured Process
Although recording and analyzing trades are distinct functions, their effectiveness depends on coordination. Recording creates the dataset; analysis extracts value from it. If recording is inconsistent, analysis becomes unreliable. If analysis is neglected, recording becomes an administrative exercise without practical benefit.
An effective trading workflow typically separates execution from evaluation. During live trading hours, the focus remains on adhering to predefined rules and documenting each action. Analytical review occurs outside active market engagement to prevent interference with decision-making.
Establishing structured review cycles enhances coherence between these processes. For example, traders may conduct brief daily reviews to ensure accurate documentation, followed by comprehensive weekly evaluations focusing on metrics and strategy assessment. Monthly or quarterly reviews can address higher-level performance trends and capital allocation considerations.
This cyclical framework supports continuous improvement without encouraging reactive behavior. Adjustments to strategy should be based on statistically meaningful evidence rather than isolated outcomes. Recording provides the evidence; analysis determines whether adjustments are warranted.
Common Misconceptions About Recording and Analyzing
A frequent misconception is that detailed recording alone constitutes analysis. Simply maintaining extensive logs does not inherently improve trading performance. Without structured evaluation, data remains dormant.
Another misunderstanding is that analysis should focus exclusively on losing trades. While assessing losses is important for identifying risk management issues or execution errors, reviewing successful trades is equally essential. Profitable trades can reveal strengths worth reinforcing or replicating.
Some traders believe that automated brokerage reports eliminate the need for personal journals. While brokerage statements provide transactional details, they rarely include contextual insights such as strategic rationale or market condition tags. Personal documentation supplements these reports with qualitative data necessary for comprehensive analysis.
There is also a tendency to overanalyze small sample sizes. Drawing conclusions from a limited number of trades may lead to premature strategy modifications. Statistical relevance requires sufficient data collected over varied conditions. Disciplined recording supports the accumulation of this data, while measured analysis protects against impulsive conclusions.
Practical Implications for Strategy Development
The distinction between recording and analyzing trades influences how strategies evolve over time. A trader seeking to refine an approach must rely on empirical evidence derived from consistent logs. For example, suppose a trader suspects that tightening stop-loss levels might improve risk-adjusted returns. Rather than making speculative changes, analysis of historical records can reveal how similar adjustments affected performance in the past.
Strategic refinement becomes systematic when guided by data. Recording ensures that experimentation is measurable. Analysis evaluates the outcome of those experiments. If changes produce statistically significant improvement, they may be incorporated permanently; if not, they can be reversed.
Long-term development depends on this iterative cycle. Traders who separate documentation from evaluation maintain clarity in both execution and refinement. The process resembles scientific methodology: gather data, analyze results, adjust hypotheses, and test again.
Conclusion
In summary, recording trades and analyzing trades represent two distinct yet interdependent phases of the trading process. Recording focuses on structured, consistent documentation of factual information. It establishes accountability, reduces memory bias, and creates the dataset necessary for evaluation. Analyzing trades transforms that dataset into insights by examining statistical performance, risk management effectiveness, behavioral tendencies, and strategic alignment.
Recording answers what occurred. Analysis explains why it occurred and what adjustments may improve outcomes. Together, these activities form a disciplined feedback system that supports systematic growth. Traders who master both processes enhance their ability to evaluate performance objectively, refine strategies responsibly, and maintain consistency over extended periods.