Introduction
Maintaining a trading journal is widely recognized as a foundational practice for individuals seeking long-term consistency in financial markets. Whether trading equities, futures, foreign exchange, or digital assets, participants rely on structured records to evaluate decisions, measure outcomes, and refine strategies. A journal acts as both a historical archive and an analytical tool. It captures not only what was traded, but also why decisions were made, how positions were managed, and what results followed.
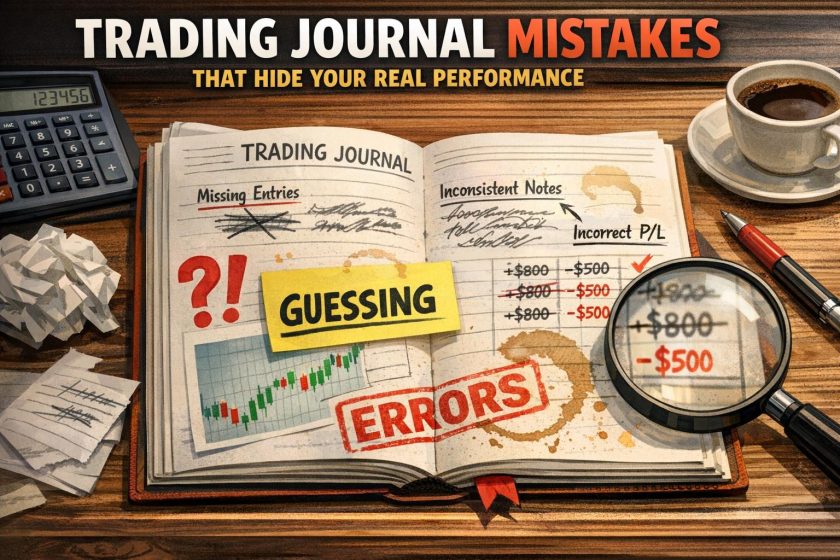
Despite its importance, many traders maintain journals that provide an incomplete or distorted view of actual performance. Errors in documentation, insufficient detail, and selective reporting can all undermine the usefulness of even a well-intentioned record-keeping system. When mistakes accumulate, the journal may inadvertently portray a version of trading success that differs materially from reality. This distortion affects strategic development, risk management decisions, and expectations about future performance.
Understanding the most frequent shortcomings in trading journals is therefore critical. By identifying and correcting these issues, traders can transform their journals into reliable performance measurement systems rather than superficial logs of activity. The following sections examine common mistakes that reduce journal accuracy and outline how more disciplined documentation can improve clarity and decision-making.
Inaccurate Data Entry
Precise documentation is the structural foundation of a useful trading journal. Every trade involves multiple quantitative variables: entry price, exit price, position size, order type, time of execution, stop placement, and target levels. When any of these data points are recorded incorrectly, overall metrics such as win rate, average return per trade, and risk-to-reward ratios become unreliable.
Inaccurate data entry often arises from haste. Traders may record approximate figures after market hours instead of capturing exact execution prices as they occur. Minor discrepancies in price may appear insignificant on individual trades, yet when aggregated across dozens or hundreds of positions, small deviations materially alter performance statistics. A difference of a few ticks per trade can significantly affect the calculated expectancy of a strategy.
Another frequent problem involves recording intended entry and exit levels rather than actual executed prices. Slippage and partial fills are realities of most markets, particularly in fast-moving conditions. By documenting theoretical levels rather than execution-confirmed data, traders unintentionally inflate apparent performance. Over time, this creates unrealistic projections and inaccurate backtesting comparisons.
Position size is another critical component that is often misreported. Recording the correct number of contracts, shares, or lots ensures that profit and loss calculations reflect actual account exposure. Without precise sizing information, metrics such as percentage return on capital and volatility-adjusted performance become unreliable.
To mitigate these issues, traders benefit from establishing standardized recording procedures. Automated integrations between brokerage platforms and journaling software can reduce manual entry errors. When automation is unavailable, immediate documentation following order execution decreases the likelihood of memory-based inaccuracies. Diligence in capturing exact figures ensures that subsequent analysis rests on verified data rather than approximations.
Failure to Include Comprehensive Trading Costs
A trading journal that excludes certain costs produces an incomplete picture of profitability. Markets impose expenses beyond simple buy-and-sell differentials. Commissions, exchange fees, clearing fees, borrowing costs for short positions, platform subscriptions, spreads, and slippage all reduce net returns. When these components are not integrated into performance calculations, net results appear inflated.
Commissions may seem negligible on a per-trade basis, particularly with low-cost brokerage structures. However, for high-frequency or intraday strategies, transaction costs accumulate rapidly. Spread costs, which represent the difference between bid and ask prices, function as implicit fees that are rarely itemized by brokers. Slippage introduces further deviations between expected and actual execution prices, especially in volatile markets or during periods of low liquidity.
Ignoring financing costs can also misrepresent returns in leveraged markets. Futures contracts involve margin requirements and overnight funding effects, while foreign exchange positions often incur swap charges. Holding equities overnight in certain scenarios may involve borrowing fees, particularly for hard-to-borrow securities sold short. Without recording these elements, traders may believe a strategy generates consistent profitability when net performance after expenses is marginal.
Comprehensive cost accounting requires incorporating both explicit and implicit expenses into each trade record. The most accurate method reflects net profit or loss after all fees and adjustments. This approach enables comparison between strategies on a standardized basis and supports realistic forward projections. It also allows traders to evaluate whether trade frequency aligns with cost efficiency, potentially prompting adjustments to position holding periods or order execution methods.
Ignoring Emotional Factors
Quantitative precision alone does not guarantee analytical depth. Trading decisions frequently occur under conditions of uncertainty, time pressure, and informational complexity. Psychological influences, whether subtle or pronounced, shape risk perception and execution discipline. Yet many trading journals limit their scope to numerical data, excluding annotations about mental state and contextual influences.
Failure to document cognitive and behavioral factors restricts the journal’s diagnostic capability. For example, deviation from a predefined strategy may not be apparent when reviewing price and size data alone. However, a brief note indicating hesitation, overconfidence, or reaction to recent losses can provide essential context. Patterns may emerge across multiple trades, such as increased position size following a series of gains or premature exits after prior losses.
Recording emotional context does not require extensive narrative writing. Concise observations about focus level, adherence to rules, and reactions to market volatility are often sufficient. Over several weeks or months, these annotations help identify recurring behavioral tendencies. A trader might discover that performance declines during specific market sessions, after certain economic reports, or following consecutive losing trades.
Incorporating psychological observations also supports accountability. When intentions are clearly documented before trade execution and compared to actual behavior afterward, deviations become easier to detect. The journal then functions not only as a financial record but also as a behavioral audit tool. Through consistent documentation, traders gain structured insight into how decision-making processes interact with market conditions.
Lacking Detailed Analysis
Recording data without engaging in structured review limits the practical value of a trading journal. Some traders document each position but rarely revisit entries except to calculate aggregate profit and loss totals. Without systematic analysis, recurring inefficiencies remain unnoticed.
Detailed post-trade evaluation involves examining whether the trade adhered to predefined criteria, whether risk parameters were respected, and how execution quality compared with expectations. This process goes beyond labeling trades as wins or losses. Profitable trades that violated rules can reinforce counterproductive habits, while losing trades that followed correct procedures may still represent valid executions within probabilistic strategies.
Performance metrics derived from aggregated journal data provide additional clarity. Calculating average return per trade, average loss size, maximum drawdown, and risk-adjusted performance indicators can highlight structural strengths and weaknesses. Segmenting performance by strategy type, instrument, session time, or volatility regime further refines understanding. Over time, such categorization may reveal that specific setups produce consistent results while others introduce unnecessary variability.
Another dimension of detailed analysis involves reviewing screenshots or visual representations of charts at entry and exit. Visual records can clarify whether trade selection aligned with defined patterns. Comparing initial rationale notes with actual price development fosters objective assessment of analytical accuracy.
The absence of structured review often leads to repetitive mistakes. Traders may continue applying strategies with diminishing effectiveness because journal entries were never examined collectively. Implementing scheduled review sessions, whether weekly or monthly, transforms isolated records into actionable insights. Through analysis, the journal evolves from passive documentation into an instrument for strategic refinement.
Overlooking the Importance of Setting Goals
A journal that records outcomes without contextual benchmarks limits interpretive value. Clear objectives provide reference points against which performance can be measured. Without defined goals, traders may misinterpret short-term fluctuations as meaningful trends or overlook gradual improvement in process quality.
Effective goal setting distinguishes between process-oriented and outcome-oriented objectives. Outcome goals may include targeted return percentages, drawdown limits, or volatility-adjusted benchmarks. Process goals focus on adherence to predefined trading plans, risk parameters, and journaling consistency. Recording both types clarifies whether deviations stem from market conditions or behavioral inconsistencies.
Short-term goals can involve maintaining a fixed maximum risk per trade or adhering to stop-loss placements without adjustment. Long-term goals might encompass improving average risk-to-reward ratios or reducing variance in monthly performance. Documenting these goals within the journal enables regular comparison between intended standards and actual practice.
Periodic review of objectives allows for recalibration based on evolving skill levels and market conditions. For instance, a developing trader may initially prioritize rule compliance rather than profit targets. As consistency improves, performance objectives may take greater prominence. Without written goals, such progression lacks structure, and evaluation remains subjective.
Integrating goals directly into journal entries reinforces alignment between strategy design and execution. Before initiating a position, referencing defined criteria ensures decisions are guided by established frameworks rather than impulse. Over time, goal-based reflection provides measurable evidence of advancement or stagnation.
Selective Reporting and Omitted Trades
Another common distortion arises from selective documentation. Traders may unintentionally omit trades that deviate from strategy guidelines or that result in significant losses. This creates survivorship bias within the journal, portraying a performance history that excludes unfavorable outcomes.
Incomplete records undermine statistical validity. Calculations of win rate and expectancy depend on comprehensive datasets. Excluding losing trades not only inflates performance metrics but also conceals risk exposure patterns. Moreover, trades taken outside established criteria often provide valuable insight into behavioral lapses. When these are omitted, the journal fails to capture critical instructional moments.
Ensuring that every executed trade is recorded, regardless of outcome or adherence to plan, preserves analytical integrity. Even mistaken entries can serve as learning references. Transparency in documentation supports accurate diagnosis of weaknesses and prevents the development of unrealistic expectations about skill level or consistency.
Inconsistent Review Frequency
A trading journal achieves its purpose only when reviewed consistently. Sporadic analysis results in fragmented insight. Traders who delay reviews until quarter-end or year-end may struggle to recall contextual details that influenced earlier decisions. Timely evaluation facilitates more precise interpretation.
Establishing a structured review schedule enhances continuity. Weekly evaluations allow identification of emerging trends in decision-making, while monthly summaries provide broader statistical perspective. Regularity also reinforces discipline, signaling that journaling is an integral component of the trading process rather than an optional administrative task.
During reviews, traders can compare recent performance metrics against historical baselines. Monitoring changes in average return, drawdown magnitude, or trade frequency supports proactive adjustments. Without consistent review intervals, these shifts may go unnoticed until substantial capital fluctuation occurs.
Overemphasis on Profit and Loss
While profit and loss figures are central to performance measurement, exclusive focus on monetary outcomes can obscure structural issues. A strategy may produce short-term gains during favorable market regimes despite suboptimal risk control. Conversely, sound methodologies may experience temporary drawdowns consistent with statistical variance.
A comprehensive journal incorporates metrics beyond net monetary result. Reviewing adherence to predefined criteria, quality of setup selection, and proportional risk allocation enhances analytical depth. By evaluating both financial and procedural measures, traders obtain a multidimensional view of effectiveness.
Distance from immediate financial outcomes can also improve objectivity. Evaluating trades based on probabilistic expectation rather than isolated results supports long-term strategy validation. When journals emphasize only daily gains or losses, analytical perspective narrows, potentially encouraging reactive adjustments rather than systematic improvements.
Conclusion
A trading journal functions as a central instrument for performance evaluation, strategic refinement, and behavioral monitoring. However, its effectiveness depends on the integrity and completeness of recorded information. Inaccurate data entry, omission of trading costs, neglect of psychological context, insufficient analytical depth, lack of defined goals, selective reporting, inconsistent review schedules, and excessive focus on profit figures all contribute to distorted assessments.
By implementing structured recording practices, incorporating comprehensive cost analysis, documenting contextual observations, and conducting regular reviews, traders create a reliable framework for measuring development. Clear objectives and full transparency in documenting every executed trade further strengthen the analytical foundation of the journal.
Over time, disciplined journaling transforms isolated trade records into a coherent dataset reflecting actual performance dynamics. This structured approach enables informed decision-making, realistic expectation management, and continual strategic improvement. For additional resources on enhancing trading strategies, consider visiting Traders University.