What to Record After Every Trade in a Trading Journal

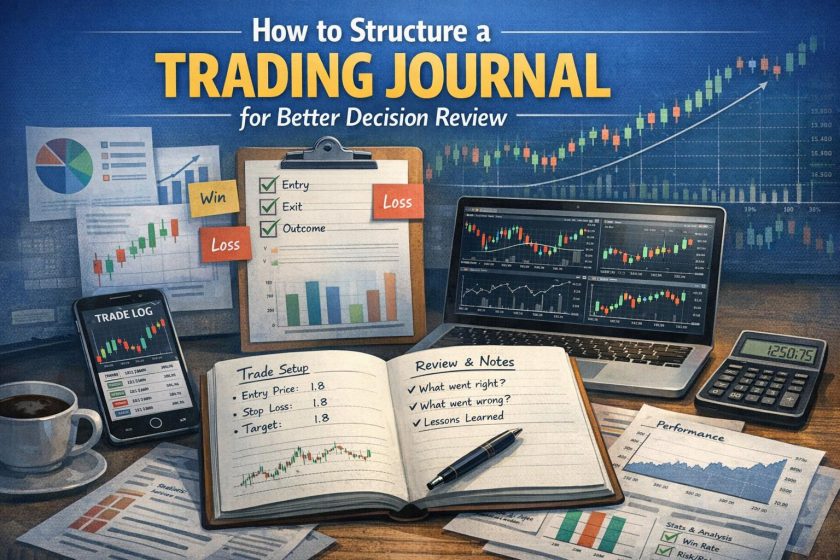
Understanding the Importance of a Trading Journal

A trading journal is a structured record of trading activity designed to support consistent improvement and informed decision-making. For traders operating in financial markets, whether in equities, derivatives, foreign exchange, or digital assets, performance depends not only on market knowledge but also on disciplined execution and ongoing evaluation. A trading journal provides the framework for that evaluation. It transforms trading from a sequence of isolated decisions into a measurable and reviewable process.

At its core, a trading journal functions as both a data repository and a performance analysis tool. It captures quantitative metrics such as entry prices and returns, while also preserving qualitative elements such as reasoning and market context. Over time, this accumulation of information enables traders to identify patterns in their behavior and strategies. Rather than relying on memory or subjective impressions, they can review precise records. This systematic approach reduces reliance on assumptions and encourages decisions grounded in evidence.

Maintaining a journal also introduces accountability. Each trade must be justified, described, and evaluated. This requirement supports adherence to predefined trading plans and discourages impulsive actions. When traders know that every decision will be documented and later reviewed, they are more likely to follow established criteria. As a result, the trading journal supports discipline, consistency, and continuous refinement of methodology.

Recording Trade Details

The foundation of an effective trading journal lies in accurately documenting the essential details of every transaction. Immediately after executing a trade, the trader should record the date and time to establish a chronological framework. The timing of a trade can reveal valuable insights when analyzed later, such as whether performance varies during certain sessions or around specific market openings and closings.

Equally important is identifying the instrument traded. This may include a stock ticker, a futures contract, a currency pair, or another asset classification. By organizing records by instrument, traders can evaluate performance across sectors or asset classes. They may discover, for example, that certain instruments align better with their strategies or risk tolerance.

The journal should clearly specify whether the position was long or short. Directional bias plays a significant role in outcomes, especially during markets characterized by sustained trends or prolonged consolidation. Tracking position type allows traders to evaluate whether their strategies perform consistently in both rising and falling markets.

The quantity of shares, lots, or contracts executed must also be documented. Position size directly affects potential profit and risk exposure. By reviewing historical position sizes alongside outcomes, traders can assess whether scaling decisions were appropriate. Patterns may emerge indicating overexposure during losing periods or insufficient sizing during profitable trends.

This detailed recording of trade attributes establishes a reliable data set. Without this foundational information, subsequent analysis becomes incomplete or potentially inaccurate. Accurate documentation ensures that performance conclusions are built on verifiable facts rather than recollection.

Entry and Exit Points

Precise recording of entry price and exit price is central to evaluating trade effectiveness. The difference between these values determines the gross result of a trade, but the implications extend further. By studying entry points, traders can determine whether their timing aligned with their strategy rules. Consistent late entries, for example, may indicate hesitation or delayed confirmation.

Exit prices provide insight into discipline and strategy execution. Traders often develop predefined rules for exiting positions, but actual behavior may differ under live conditions. Documenting exits helps detect deviations from planned thresholds. If exits consistently occur before reaching projected targets, it may reflect premature decision-making. Conversely, exits that exceed stop-loss levels may indicate a failure to adhere to risk management guidelines.

Recording stop-loss and take-profit levels at the time of trade entry adds further clarity. These predefined parameters define the intended risk-reward structure. Comparing planned exit levels with actual outcomes highlights whether the original risk framework was respected. Over time, this data can reveal whether certain stop distances are consistently too tight or excessively broad relative to market volatility.

Analyzing entry and exit trends also supports refinement of technical or fundamental signals. If trades triggered by a specific indicator show lower average returns, adjustments may be warranted. The journal thus becomes a feedback mechanism through which strategy quality can be evaluated and improved.

Analyzing Market Conditions

Market context plays a decisive role in trade outcomes. Documenting prevailing market conditions at the time of execution adds interpretive depth to the numerical results. A trade that performs poorly in a range-bound environment may still be valid if the strategy is designed primarily for trending conditions. Without contextual documentation, such distinctions are difficult to assess.

Describing whether the market was bullish, bearish, or neutral allows traders to categorize results by overall direction. Performance analysis segmented by market phase can reveal strengths and weaknesses. A trend-following system may exhibit strong returns during sustained directional movement but underperform during consolidation. Recognizing this pattern allows the trader to adapt expectations or modify strategy deployment.

In addition to directional bias, traders should record significant economic news, corporate announcements, or geopolitical events occurring near the time of the trade. Macroeconomic releases, earnings reports, and central bank statements can influence price volatility and liquidity. By noting these factors, traders gain perspective on whether outcomes were driven primarily by strategy execution or by external catalysts.

This contextual layer transforms isolated trade data into a comprehensive analytical record. Patterns often emerge only when market environment is considered. A strategy that appears inconsistent in aggregate may demonstrate strong performance within specific conditions. Thorough documentation enables such nuanced evaluation.

Trade Rationale and Strategy

Beyond numerical data, every journal entry should include a concise explanation of the rationale behind the trade. This section captures the trader’s reasoning at the moment of decision. It may reference technical indicators, chart patterns, fundamental analysis, quantitative signals, or a combination of factors. Recording this information ensures that decisions align with the larger strategies defined in the trading plan.

By documenting rationale, traders create a reference point for later comparison. If outcomes repeatedly diverge from expectations, reviewing the original reasoning can highlight flaws in assessment. It may reveal that certain setups were misinterpreted or that confirmation criteria were inconsistently applied.

This process also promotes consistency. When traders articulate their reasoning in writing, they are more likely to adhere to structured criteria rather than act on impulse. The act of documentation reinforces alignment with planned methodologies. Over time, this contributes to systematic refinement rather than random experimentation.

Furthermore, analyzing rationale entries across many trades can reveal cognitive biases. If certain justifications recur during losing trades, they may signal overconfidence in specific patterns or indicators. Recognizing such tendencies supports objective recalibration of strategy parameters.

Outcome and Performance Metrics

After closing a position, the journal should record the final profit or loss. This figure should account for transaction costs, commissions, and slippage to ensure an accurate representation of net performance. Gross figures alone may overstate effectiveness.

In addition to raw results, traders should calculate the return on investment (ROI) relative to capital committed. ROI allows comparisons across trades of varying sizes. A smaller trade yielding a higher percentage return may demonstrate greater efficiency than a larger position with a modest gain.

The risk-reward ratio is another critical metric. By comparing the potential loss defined by the stop-loss with the intended gain defined by the target, traders assess whether the projected reward justifies the risk taken. Over time, aggregate analysis of risk-reward metrics can indicate whether the overall expectancy of the trading system is positive.

Advanced performance evaluation may include metrics such as win rate, average gain versus average loss, maximum drawdown, and expectancy per trade. These calculations provide an objective measure of system viability. Rather than relying on isolated profitable trades, traders assess performance across a statistically meaningful sample.

The journal thus becomes a repository of measurable outcomes. Quantitative evaluation reduces reliance on perception and fosters data-driven improvement.

Emotional Reflection

Although financial markets operate on quantitative principles, trading decisions are influenced by psychological factors. Including commentary on one’s emotional state before, during, and after a trade contributes to comprehensive analysis. This reflection should be factual rather than expressive, focusing on observable states such as hesitation, overconfidence, distraction, or urgency.

Recording emotional context allows traders to correlate psychological conditions with performance outcomes. For instance, a series of trades entered during periods of fatigue may show inconsistent adherence to rules. Awareness of such patterns supports proactive adjustment of trading schedules or routines.

This dimension of documentation does not replace quantitative evaluation but complements it. By recognizing the interaction between emotional state and execution quality, traders can implement safeguards such as predefined daily limits or structured review sessions. Consistent monitoring of psychological factors contributes to long-term stability in trading behavior.

Lessons Learned

Each journal entry should conclude with an assessment of lessons learned. This section synthesizes quantitative results, contextual factors, and self-evaluation into actionable insights. Lessons may relate to strategy refinement, risk management, timing adjustments, or behavioral discipline.

The purpose of this concluding reflection is not to criticize outcomes but to extract constructive information. Positive trades may reveal effective practices that should be reinforced, while negative trades may identify areas for systematic improvement. Consistent review of lessons across multiple entries allows traders to recognize recurring weaknesses and strengths.

Over time, the accumulation of documented insights forms a knowledge base unique to the individual trader. This personal archive can guide future rule adjustments and training priorities. By converting experience into recorded learning, the trading journal supports structured professional development.

Utilizing the Trading Journal

The value of a trading journal depends on regular and methodical review. Periodic analysis should be conducted to identify patterns in performance metrics, strategy effectiveness, and behavioral tendencies. Monthly or quarterly reviews can reveal trends that are not apparent from examining individual trades in isolation.

During review sessions, traders may categorize trades by setup type, market condition, or time frame. Statistical summaries help determine which categories generate consistent returns. Strategies that underperform can be adjusted or discontinued, while strong-performing approaches may warrant increased allocation of capital.

Integration of journal findings with ongoing education enhances their usefulness. As traders study new methodologies or refine existing systems, they can compare theoretical concepts against historical journal data. This comparison ensures that modifications are grounded in empirical evidence rather than assumption.

The journal should also inform risk management practices. If analysis indicates that certain drawdowns follow specific patterns, traders can implement preventative measures such as reducing exposure during similar conditions. Continuous feedback between record-keeping and execution creates an adaptive framework.

Maintaining Consistency and Structure

For a trading journal to remain effective, it must be maintained consistently. Irregular entries undermine the integrity of performance analysis. Standardized formats, whether digital spreadsheets or specialized software, ensure that essential data fields are captured for every trade.

Clarity and organization facilitate efficient review. Columns for numerical data should be clearly defined, while narrative sections should remain concise and relevant. Overly fragmented or inconsistent formatting complicates analysis and reduces the journal’s practical value.

Adopting a structured approach also simplifies long-term comparison. As trading strategies evolve, standardized data enables cross-period evaluation. This continuity supports objective assessment of whether modifications produce measurable improvement.

Long-Term Benefits of Systematic Documentation

Over extended periods, the cumulative effect of disciplined journaling becomes significant. Traders develop a detailed historical record that reflects strategic evolution, performance fluctuations, and behavioral adjustments. This longitudinal perspective encourages strategic thinking and reduces short-term reaction to isolated outcomes.

A well-maintained journal also enhances transparency and credibility. For professional traders, it can serve as documentation of methodology and performance consistency. For independent traders, it provides internal verification of progress and helps establish realistic expectations.

Systematic documentation ultimately supports the transition from discretionary, reactive trading toward structured, rule-based execution. By combining precise numerical tracking with contextual and behavioral reflection, the trading journal functions as both a measurement instrument and a development tool. Its consistent use fosters disciplined decision-making, evidence-based strategy refinement, and sustained improvement in trading performance.

How to Structure a Trading Journal for Better Decision Review

Introduction

A trading journal is a systematic record of trading activity designed to improve analysis, execution, and long-term performance. In financial markets where outcomes are influenced by variability, incomplete information, and changing conditions, traders rely on structured processes to reduce inconsistency. A journal functions as both a historical archive and an analytical framework. By documenting trades in a disciplined manner, traders create a reliable source of data that can be examined objectively.

The value of a trading journal extends beyond simple recordkeeping. It provides a mechanism for evaluating decision quality, measuring adherence to strategic rules, and monitoring behavioral tendencies. Without written documentation, traders often rely on memory, which is subject to distortion and selective recall. A journal replaces subjective recollection with verifiable information. Over time, this documentation supports incremental improvements that can substantially influence performance.

Purpose of a Trading Journal

The primary purpose of a trading journal is to create accountability and structure within the trading process. Each recorded entry requires the trader to clarify intent, define risk parameters, and articulate the reasoning behind the trade. This reduces impulsive behavior and increases transparency in decision-making.

A journal also enables systematic learning. Financial markets generate continuous feedback through winning and losing trades. However, without structured review, that feedback remains unorganized and difficult to interpret. Recording each trade makes it possible to compare expected outcomes with actual results. Traders can evaluate whether profits were achieved through disciplined execution or favorable randomness. Similarly, losses can be assessed to determine whether they resulted from strategic flaws or acceptable risk exposure.

Another important function is performance tracking. Traders often focus on short-term outcomes, which can obscure long-term trends. A journal provides cumulative data that reveals patterns across months or years. These patterns may include consistent profitability in specific market conditions, weaknesses during particular times of day, or overexposure to correlated assets. Identifying such tendencies is essential for improving strategic alignment.

In addition, a trading journal facilitates strategic refinement. As markets evolve, strategies that were once effective may require adjustment. By maintaining a structured database of past trades, traders can test modifications against historical records. This evidence-based approach reduces reliance on speculation when adapting strategies.

Components of a Trading Journal

Although individual preferences vary, certain components form the foundation of an effective trading journal. Consistency in recording these elements is more important than complexity.

Trade Details: Each entry should specify the date, time, trading instrument, platform used, and market conditions at execution. Information regarding position size, entry price, exit price, and stop-loss or take-profit levels must be documented accurately. Including the risk amount in monetary and percentage terms enables effective comparison across trades. For traders operating in multiple markets, noting asset class or sector exposure can provide additional clarity.

Reason for Trade: Every trade should be accompanied by a clearly defined rationale. This may involve technical indicators, price patterns, volatility conditions, macroeconomic data, earnings announcements, or quantitative signals. The explanation should describe the setup criteria and confirm that predefined conditions were satisfied. By articulating reasoning before or immediately after entry, traders limit retrospective justification and maintain objectivity.

Outcome of the Trade: Outcomes should include absolute profit or loss, percentage return relative to account size, and risk-adjusted measures when applicable. It is useful to record whether the exit followed the predefined plan or was influenced by discretionary judgment. Capturing slippage, commissions, and spread costs ensures realistic assessment of net performance. If scaling in or out of positions occurred, this process should be described to preserve contextual accuracy.

Trade Reflection: Reflection distinguishes a journal from a simple transaction log. After a trade closes, traders should evaluate execution quality, timing, discipline, and rule adherence. Emotional responses such as hesitation, overconfidence, or anxiety may be noted objectively without exaggeration. Identifying procedural errors, missed signals, or improvements in execution contributes to skill development. Over time, reflective entries reveal behavioral patterns that influence outcomes.

Structuring Entries for Maximum Utility

Organization determines whether a trading journal functions effectively. Entries should follow a consistent template that simplifies comparison. Using standardized fields guarantees that critical information is not omitted. Many traders design templates divided into pre-trade, in-trade, and post-trade sections. This chronological structure preserves decision clarity and distinguishes analysis performed before execution from interpretation formed afterward.

Clarity in language also matters. Statements such as “entered because price looked strong” lack analytical value. A more structured description would specify measurable conditions, such as “entered after breakout above resistance level with volume exceeding 20-day average.” Precision supports future evaluation because objective criteria can be tested and replicated.

Maintaining chronological continuity is equally important. Journals should record trades sequentially, even during losing streaks. Omitting trades disrupts data integrity and reduces analytical reliability. Consistent documentation fosters discipline and ensures that review sessions represent the full performance record.

Benefits of Structured Reviewing

Regular review sessions convert raw data into actionable insight. Without periodic analysis, journals accumulate information without delivering improvement. A structured review process may occur weekly, monthly, or quarterly, depending on trading frequency.

Pattern Recognition: Through systematic evaluation, traders can identify recurring scenarios associated with favorable outcomes. For example, specific chart formations, volatility expansions, or macroeconomic conditions may correspond with higher success rates. Conversely, particular signals may underperform in low-liquidity environments. Recognizing these associations allows strategic adjustment grounded in empirical observation.

Behavioral patterns also emerge through review. Traders may discover tendencies to exit profitable trades prematurely or widen stop-loss levels during volatile periods. Identifying these tendencies creates opportunities for corrective rule implementation. Because behavioral consistency significantly influences performance, awareness of such patterns contributes to stability.

Improved Discipline: The obligation to document each trade encourages rule-based conduct. Traders aware that every deviation will be recorded are more likely to adhere to predefined criteria. This accountability reduces impulsive decision-making and reinforces execution standards. Over extended periods, disciplined behavior becomes habitual, supporting consistent performance.

Performance Metrics: Quantitative analysis transforms journal entries into measurable indicators. Calculating win rate, average gain, average loss, expectancy, maximum drawdown, and risk-reward ratio provides a structured evaluation of strategy viability. These metrics allow traders to determine whether profitability arises from high accuracy, favorable reward-to-risk ratios, or a combination of both.

Beyond basic metrics, examining trade duration, exposure by asset class, and correlation between trades enhances strategic alignment. For example, if several losing trades occur simultaneously across correlated positions, portfolio diversification rules may require modification. Statistical evaluation introduces analytical rigor and reduces reliance on anecdotal reasoning.

Psychological and Behavioral Insights

Financial decision-making involves cognitive biases that can influence execution. A trading journal helps identify and mitigate these biases. By recording thoughts before entering trades, traders can detect patterns such as confirmation bias, where only supportive evidence is considered. Documentation also reveals instances of loss aversion, where traders hesitate to close losing positions due to reluctance to realize losses.

Overconfidence may manifest through excessive position sizing following a series of profitable trades. Fear may result in inconsistent strategy application after periods of volatility. When these tendencies are systematically recorded, they become observable and manageable. Structured reflection provides a foundation for implementing behavioral safeguards such as predefined risk limits or cooling-off periods.

Maintaining objectivity during reflection is essential. Emotional language can obscure analytical clarity. Instead of describing a trade as “frustrating” or “exciting,” traders should focus on identifiable factors such as rule deviations or timing errors. This neutral approach supports rational evaluation.

Risk Management Integration

A complete trading journal integrates risk management records directly into each entry. Risk per trade, percentage of total capital exposed, and aggregate exposure at any given time should be documented. Tracking these values ensures that trades remain aligned with account preservation principles.

Reviewing risk data can reveal inconsistencies. For example, if larger position sizes coincide with reduced win rates, position sizing rules may require adjustment. Similarly, persistent drawdowns following correlated exposures indicate a need for diversification controls. Integrating risk information into journal analysis strengthens long-term sustainability.

Monitoring maximum consecutive losses and overall drawdown duration also informs capital allocation decisions. By analyzing these trends, traders develop realistic expectations regarding volatility in returns. This reduces the likelihood of abrupt strategy abandonment during temporary downturns.

Choosing the Right Format for Your Journal

The effectiveness of a trading journal depends partly on its accessibility and usability. Traders should choose a format that encourages consistent updating and facilitates analysis.

Physical Journals: Handwritten journals offer a tactile method of recording observations. Writing by hand requires deliberate engagement, which can enhance reflection quality. Physical journals may be suitable for discretionary traders who prioritize narrative analysis. However, calculating performance metrics manually can become time-intensive as trade volume increases.

Spreadsheets: Digital spreadsheets provide flexibility and computational capability. Traders can design customized templates incorporating automatic calculations of performance metrics. Filters and sorting functions allow targeted analysis by instrument, timeframe, or strategy type. Spreadsheets are particularly useful for active traders managing large datasets.

Specialized Software: Dedicated trading journal applications often integrate directly with brokerage platforms, importing trade data automatically. These systems may include graphical performance dashboards, risk analytics, and tagging functions for categorizing trades. Automation reduces manual entry errors and saves time. When selecting software, traders should evaluate compatibility with their trading platform and ensure data security standards meet regulatory requirements.

Regardless of format, consistent usage is more important than technological sophistication. A simple but regularly updated journal is more effective than an advanced system used inconsistently.

Implementation and Consistency

Establishing a journal requires initial setup and procedural commitment. Traders should define the variables most relevant to their strategy and create a standardized template. Allocating a specific time for updates, such as immediately after trade execution or at the end of each trading session, ensures continuity.

Regular review sessions should be scheduled independently of daily trading activity. Separating execution from evaluation reduces bias and promotes objective analysis. During these sessions, traders examine aggregated data, compare performance against strategic goals, and document conclusions for future reference.

Consistency reinforces habit formation. As journaling becomes integrated into routine operations, it transitions from a corrective mechanism to a preventative tool. Traders begin anticipating journal review while executing trades, encouraging disciplined conduct in real time.

Conclusion

A structured trading journal supports systematic improvement by combining detailed documentation with analytical review. Recording trade details, rationales, outcomes, and reflections transforms individual transactions into a coherent dataset. Structured reviewing enables recognition of strategic strengths and weaknesses, while quantitative metrics provide objective performance measurement.

Through disciplined journaling, traders gain insight into behavioral tendencies, refine risk management practices, and enhance strategic alignment. The choice of format—whether physical, spreadsheet-based, or software-driven—should prioritize usability and consistency. When maintained regularly and reviewed methodically, a trading journal becomes an essential instrument for long-term development and informed decision-making in financial markets.

The One Trading Book That Changed My Entire Approach

Introduction

The realm of trading is a complex and often daunting environment. Many traders spend years developing strategies, only to find them consistently underperforming. Among the myriad of resources available to traders, certain books can sometimes substantially alter one’s approach to trading. This article delves into one such book that had a profound impact on my trading methodology, sparking a complete overhaul in my approach.

The Book That Made the Difference

In my journey to refine trading strategies, I encountered various books promising insights and techniques. However, it was not until I read “Trading in the Zone” by Mark Douglas that my perspective began to shift. Unlike many trading books that focus predominantly on technical analysis or chart patterns, Douglas’s work highlights the importance of trading psychology. This book illuminated aspects of trading that I had previously overlooked, particularly the critical role of mental discipline and attitude.

Key Insights from the Book

Douglas’s book provided several pivotal insights that have structured the way I perceive each trading activity.

Understanding Probabilities: One significant takeaway was the concept that trading results are governed by probabilities. This realization emphasized the importance of managing risks and accepting losses as an inherent aspect of trading. It shifted my viewpoint from a deterministic outlook to one that understands the nature of markets as inherently uncertain.

Emotional Discipline: The book stresses the necessity of maintaining emotional control when making trading decisions. This includes managing fear and greed, which often cloud judgment during transactions. Recognizing emotional impulses and learning ways to deal with them effectively became fundamental aspects of my trading routine.

The Illusion of Control: Douglas argues that many traders operate under an illusion of control, believing they can predict market movements. Understanding that markets are unpredictable allowed me to focus more on strategy and risk management rather than prediction. By accepting that I cannot control market outcomes but can manage my reactions to them, I found greater stability in my trading endeavors.

Implementing the Teachings

After digesting the insights from “Trading in the Zone”, I began integrating its lessons into my trading practice. This involved reshaping my trading plan to incorporate the management of emotions and acceptance of probabilistic outcomes. The transformation in my approach included several key strategies:

Risk Management Strategies: Implementing strict risk management protocols became a priority. This included setting stop-loss orders to protect against significant losses and ensuring that each trade carried an acceptable risk-reward ratio. My approach to risk assessment matured, with a clear focus on preserving capital.

Developing a Trading Routine: Establishing a disciplined trading routine helped maintain consistency. This routine was not just about placing trades but also involved regular reviews of performances and adaption to new market conditions. Consistency in preparation, execution, and review processes became the backbone of my trading activities.

Continuous Learning and Adaptation: Recognizing that trading is a journey, not a destination, has encouraged a mindset of continuous learning and adaptation. Market conditions are constantly evolving, meaning strategies must remain flexible and responsive. Continuous education through reading, seminars, and practice becomes a non-negotiable aspect of preparedness in trading.

Resources for Further Exploration

For those interested in exploring the psychological aspects of trading further, several resources offer valuable insights. Websites such as Trader Psychology provide articles and resources focused on the mental aspects of trading, offering a deeper dive into techniques that enhance mental fortitude in trading scenarios.

Additionally, Investopedia offers a wide range of articles and tutorials not only on the technical aspects of trading but also on trading psychology. It serves as an extensive resource for both beginners and experienced traders looking to expand their knowledge base.

Finally, platforms like Amazon host a plethora of books dedicated to trading, including works that focus on psychology and strategy refinement. These resources are helpful for those wishing to explore detailed accounts and advice from seasoned trading professionals.

Conclusion

While many trading resources emphasize strategies and techniques, “Trading in the Zone” by Mark Douglas shifted my focus towards understanding the intrinsic psychological elements of trading. This new perspective has not only changed how I approach trading but also enhanced my overall effectiveness in the market. By cultivating a blend of strategy-focused and psychology-driven approaches, I have been able to develop a more holistic view of trading. Embracing the insights from this book has been pivotal in fostering a more rational and disciplined trading practice, ultimately leading to a more rewarding trading journey.

In summary, the insights and practical approaches provided by Mark Douglas have trained attention on the aspects of trading often neglected by those focusing purely on technical indicators. The power of mindset, discipline, and continuous refinement in trading strategies cannot be overstated. By internalizing these lessons, traders can move toward a greater understanding of how internal states affect trading decisions, and consequently, improve their overall trading performance.

How I Used Market Sentiment to Predict a Huge Move

Understanding Market Sentiment

Market sentiment is a crucial factor in the dynamics of financial markets, encapsulating the collective attitude and emotional state of investors towards market conditions. This prevailing sentiment, typically classified as either bullish (optimistic) or bearish (pessimistic), significantly influences trading behaviors and price movements. Understanding shifts in market sentiment can thus provide investors with strategic insights and a potential edge in navigating the complexities of investment decision-making.

The Role of Sentiment Analysis

The core objective of sentiment analysis is to evaluate the emotional tones and opinions expressed by investors and stakeholders. This is achieved by rigorously examining data from diverse sources, which range from traditional media outlets like newspapers and financial journals to modern channels such as social media platforms and varied financial reports. This form of analysis empowers investors to understand and predict market trends by highlighting the crucial role emotions such as fear, greed, and exuberance play in distorting market prices away from intrinsic values.

Sources of Sentiment Data

Gathering and interpreting sentiment data involves delving into several key sources:

News Impact: The influence of news on investor sentiment cannot be overstated. Headlines and in-depth articles alike play a pivotal role in shaping public perception. Through analyzing the tone, whether it be positive, negative, or neutral, and the sheer volume of news coverage, investors can ascertain the sentiment surrounding a particular security or market.

Social Media Trends: With the proliferation of platforms like Twitter, Reddit, and others, real-time sentiment tracking has become feasible. These platforms serve as a vast reservoir of investor sentiment, with individuals expressing their views openly, allowing for the aggregation of public opinion that could suggest future market movements.

Investor Surveys and Reports: Regular surveys and comprehensive reports produced by various financial organizations aim to capture the current mood within the investment ecosystem. These tools provide quantitative metrics that reflect the collective sentiment and are often used to benchmark investor confidence levels.

Using Sentiment to Predict Market Movements

Utilizing sentiment analysis in isolation may yield insights; however, the real potency emerges when combined with other investment analysis techniques. Here are some strategies on how sentiment can be effectively harnessed:

Identifying Extremes: A crucial facet of sentiment analysis is the identification of sentiment extremes. When investor sentiment hits unusually high levels of optimism or pessimism, these can act as contrarian indicators, often preceding a reversal in market trends. For example, overwhelming bullish sentiment might signal an impending downturn, while pervasive bearishness could hint at a potential market bottom.

Divergence Signals: One intriguing aspect of sentiment analysis is the observation of divergences between price movements and sentiment indicators. A classic divergence may involve a scenario where market prices continue to climb while sentiment begins to wane. Such discrepancies often serve as precursors to trend reversals, offering alert investors an opportunity to reposition their strategies accordingly.

Volume Analysis: The confluence of sentiment shifts and trading volume provides another layer of analytical complexity. When a marked change in sentiment is coupled with significant increases in trading volume, it suggests robust investor conviction and could signal significant market moves. This confirmation through volume can bolster the reliability of sentiment-based forecasts.

Case Study: Predicting a Market Upsurge

Consider a scenario where an in-depth analysis of a security revealed imminent upward movement. Several sentiment indicators pointed towards this direction. A surge in positive news coverage across varied and reputable media outlets was paralleled by a noticeable increase in optimistic discussions within social media circles. Together, these indicators reflected growing investor confidence. However, the actual price of the security experienced a temporary plateau, demonstrating a noticeable sentiment-price divergence. This situation presented an archetypical example of how sentiment analysis, when rightly interpreted, could offer foresight into future price performance. Accurately predicting these movements provided a potential advantage to investors who acted upon these insights.

In sum, sentiment analysis constitutes a formidable tool for investors aiming to predict market dynamics more accurately. Investors who grasp the psychological underpinnings and behavioral drivers behind market sentiment are better positioned to anticipate significant market shifts. Those seeking to advance their analytical prowess in investment strategies can access a wealth of resources that delve into sentiment analysis. For a more comprehensive introduction to sentiment analysis methodologies, consider exploring relevant educational materials designed to enhance your analytical capabilities in financial markets.

The Trade That Taught Me About Liquidity Traps

Understanding Liquidity Traps through Personal Experience

In the intricacies of finance and economics, a liquidity trap stands as a particularly challenging phenomenon, often difficult to fully understand without direct experience. The theoretical framework of a liquidity trap was something I was aware of on an intellectual level. However, it wasn’t until a particularly intricate trade scenario that I began to truly comprehend its ramifications. This first-hand experience served as an illuminating real-world example, shedding light on what is often discussed in theoretical economics but less frequently observed with clarity.

What is a Liquidity Trap?

A liquidity trap emerges when a country’s interest rates are exceedingly low, yet the propensity to save remains disproportionately high. This situation effectively renders conventional monetary policy useless. Despite monetary incentives intended to encourage borrowing — such as reduced interest rates — both consumers and businesses choose to hoard cash. This cautionary tendency results in stagnant economic growth. In other words, no matter how favorable borrowing conditions might be, the expected ripple effect of economic stimulus is absent, as consumers and businesses are reluctant to engage in spending or investing.

The Trade that Highlighted the Trap

Looking back, several years ago, I found myself immersed in a trade that starkly highlighted the dynamics of a liquidity trap. During that time, central banks worldwide were aggressively reducing interest rates, a strategy aimed at stimulating economic activity. It was expected that these conditions would lead to a flurry of economic engagement and revitalization. However, contrary to the anticipated result, the economic boost that lower interest rates were supposed to bring did not come to fruition.

As part of my investment strategy during this period, I operated under the assumption that reduced interest rates would act as a catalyst for business investments and consumer spending, thereby improving company earnings and driving up stock prices. Nonetheless, the unfolding reality was quite different.

The Reality of Consumer Behavior

Instead of the increased financial activity I expected, it became evident that both businesses and consumers were opting to cling to their cash reserves. This behavioral tendency can largely be attributed to prevailing uncertainty regarding the future economic landscape. This uncertainty instilled a precautionary savings mindset among both businesses and individuals. As a result, neither group was inclined to commit to increased spending or investment. Even as money was readily available to borrow at low rates, the expected hike in demand for investments did not come to pass, leaving the economy in a state of stagnation.

Policy Implications

From the standpoint of policy-making, encountering a liquidity trap introduces a set of formidable challenges. The conventional tools — primarily interest rate adjustments — lose their traditionally reliable effectiveness. Consequently, policymakers might need to pivot toward alternative strategies, which often involve fiscal policy interventions as opposed to purely monetary solutions. For instance, government spending could be increased or tax policies adjusted to stimulate demand more directly. Understanding these intricate dynamics is crucial to devising strategies that could help bypass similar economic pitfalls in the future.

Lessons Learned

This trade experience turned out to be an invaluable lesson highlighting the significance of understanding broader economic conditions. It became clear that relying solely on interest rate movements to predict market behavior and economic trajectories is an oversimplification. In addition to monitoring interest rates, it’s imperative to gauge overall economic sentiment and understand the behavior of market participants, as these elements have substantial impacts. Recognizing the early signs of a liquidity trap can lead to more informed investment decisions and help in setting realistic expectations regarding economic recovery trajectories.

Further Exploration

For those who wish to explore the mechanics and implications of liquidity traps more deeply, there is a wealth of economic literature that delves into this subject matter. Many renowned economic publications and institutions offer insights into this phenomenon, often enriched with historical examples and case studies. A pragmatic starting point for in-depth exploration would be perusing analyses provided by reputable financial institutions or economic think tanks. These resources frequently deliver valuable perspectives that deepen the understanding of liquidity traps, offering both theoretical and applied insights that can inform better strategies and decisions in the realm of finance and economics.

How I Used Fibonacci for the First Time and It Actually Worked

Introduction to Fibonacci

The Fibonacci sequence is an intriguing mathematical series where each number is the sum of the two preceding ones, generally beginning with 0 and 1. This concept is much more than an intellectual curiosity; it serves as a pivotal tool across various domains such as finance, nature, and art. My initial foray into using Fibonacci was within the financial trading landscape, where its predictive capabilities offered impressive insights.

Fibonacci in Trading

Within the bustling corridors of financial markets, Fibonacci retracement levels are a staple for identifying possible support and resistance thresholds. Such levels are instrumental for traders who aim to forecast potential reversal points in asset prices. These pivotal levels arise from the Fibonacci sequence and its associated ratio, famously known as the Golden Ratio, which is approximately 1.618.

Application in Forex Trading

As I stepped into the world of forex trading, I encountered strategies that made use of Fibonacci retracement levels. The foundational step involved pinpointing a considerable price movement on a trading chart, be it ascending or descending. Once identified, I employed the Fibonacci tool, an integral feature on most trading platforms, to map out these levels.

Implementing the Strategy

With the levels plotted, the focus shifted to key percentages: 23.6%, 38.2%, 50%, 61.8%, and 100%. These levels are crucial as they represent prices where pullbacks may occur. Such price reactions are no fluke; they offer ideal points for placing entry or stop-loss orders.

Navigating through market dynamics, the reaction of prices at these levels substantiated their potential. They served as indispensable guides, helping in setting strategic points on the trading chart.

Outcome and Observations

In applying this analytical tool, I set retracement levels on a chart during a discernible bullish trend. Remarkably, the price retraced precisely to the 61.8% level, a prominent Fibonacci marker. Following this retracement, the price reversed direction, underscoring the tool’s efficacy in predicting support levels. This alignment allowed the pinpointing of a strategic entry, culminating in a rewarding trade experience.

Fibonacci Beyond Trading

The influence of the Fibonacci sequence is not confined to the financial sector; its applications reach far and wide, touching upon various aspects of life and science:

Nature: Many natural elements display patterns conforming to the Fibonacci sequence. From the spirals of galaxies to the alignment of sunflower seeds, these patterns speak to a universal order.

Art and Architecture: The aesthetics of Fibonacci and the Golden Ratio grace artworks and architectural masterpieces, offering proportions that please and inspire.

Beyond art and nature, the sequence’s implications are vast and notably impactful in fields as diverse as biology, physics, and computer algorithms. Exploring how Fibonacci interlaces with these fields can provide a deeper understanding of its significance and applicability.

Conclusion

My initial experience with using the Fibonacci principle in trading underlined the tangible power of mathematical insights. Although it doesn’t guarantee infallible predictions, it certainly fortifies the analytical framework of anyone embarking on financial ventures or exploring domains where predictive patterns hold sway.

Tapping into resources like financial education platforms or seeking expert advice could further illuminate the versatile applications of Fibonacci retracements. Engaging with these resources allows for a richer exploration of Fibonacci, unveiling its myriad uses beyond the financial spectrum.

Why I Stopped Trading Short-Term Timeframes

Introduction

Trading in short-term timeframes, often referred to as day trading or intraday trading, has long been an attractive option for many investors looking to make quick profits. However, several factors have led me to step back from this approach. The decision was based on a combination of practical insights and empirical evidence rather than emotional reactions.

Market Volatility

Engaging in short-term trading demands a continual awareness and adeptness at recognizing subtle movements in the market. The allure of substantial potential returns exists within this realm, yet the unpredictability of financial markets introduces significant risks. The volatility inherent in short-term trading often leads to outcomes that can fluctuate dramatically. While the possibility of sizeable gains might be enticing, the corresponding risk of significant losses was not a viable long-term strategy for my financial plans.

Understanding Volatility

Volatility is an innate characteristic of financial markets, driven by factors such as economic news, geopolitical events, and company announcements. In the context of short-term trading, this volatility is magnified, requiring traders to possess a keen sense of timing and market prediction. The rapid fluctuations can mean that even well-analyzed trades do not always behave as expected. Inconsistent market behavior makes it difficult to establish predictable patterns, suggesting that reliance on short-term strategies could undermine consistent profitability.

Increased Transaction Costs

The nature of short-term trading necessitates frequent buying and selling, which inherently gives rise to elevated transaction costs. These costs include broker fees, taxes, and the bid-ask spread – the difference between the highest price a buyer is willing to pay and the lowest price a seller will accept. When compounded over numerous trades, these seemingly small expenses accumulate substantially over time. The transaction costs incurred can seriously depreciate net profits, often negating the financial advantages that short-term gains might offer. For investors not meticulously accounting for these accumulating costs, the allure of short-term profits can swiftly shift into financial disadvantage.

Time Commitment and Stress

Participating actively in short-term trading demands an extraordinary level of attention and immediate decision-making capabilities. This necessity translates into a pronounced time commitment, often requiring traders to be perpetually engaged with market developments during trading hours. The continuous need to monitor market conditions can also result in elevated stress levels, imposing adverse effects on overall well-being and cognitive functioning. Scholars have conducted studies to demonstrate how adhering to such exhaustive trading schedules is linked with increased levels of stress and, in extreme cases, trader burnout, where mental and physical fatigue impair decision-making capabilities.

Balancing Time and Mental Well-being

The high-pressure environment associated with short-term trading can detract from other life pursuits and obligations. Establishing balance between economic pursuits and personal life becomes a challenge, as trading demands do not adhere to a conventional work-life balance framework. For traders unable to effectively manage stress and allocate time judiciously, this imbalance can lead to detrimental effects on both trading success and personal well-being.

Psychological Factors

Short-term trading encapsulates certain psychological challenges that can inadvertently affect decision-making quality. The constant exposure to market fluctuations can evoke emotional responses, compelling traders to make hasty and ill-informed decisions. The impulse to react rapidly to short-term price changes can lead to the temptation of ’emotional trading,’ which is often guided more by sentiments than by informed judgement. Such emotional decision-making can invite substantial financial losses.

The Interplay of Psychology and Trading

Emotion-driven trading circumvents analytical rigor and often results in the disregard of structured trading plans. Psychological vulnerabilities, including overconfidence or fear, excessively influence trading decisions guiding them away from pre-established strategies. Those experienced in behavioral finance affirm that understanding and regulating emotional responses are crucial factors in enhancing short-term trading effectiveness. Emphasizing a disciplined approach minimizes the impact of psychological biases and fosters well-reasoned decision-making processes.

Conclusion

In deciding to withdraw from short-term trading, I’ve shifted my focus toward long-term strategies that are better aligned with my financial aspirations and overall lifestyle preferences. These longer-term objectives allow for a more stable and controlled financial journey, providing opportunities for calculated growth while mitigating the pressures inherent in day trading. While short-term trading can undoubtedly suit certain investors who thrive in high-paced environments, comprehending the associated risks and broader implications illuminates why this approach may not be appropriate for everyone. Recognizing one’s personal risk tolerance, time capabilities, and lifestyle goals is essential when evaluating trading strategies. Exploring alternative methods can lead to more rewarding financial experiences and greater personal satisfaction, directing investors toward informed and sustainable investment paths.

How I Finally Mastered Support and Resistance Levels

Introduction to Support and Resistance Levels

Understanding support and resistance levels is essential for anyone involved in trading or investing. These levels are critical markers on price charts that suggest where the price of an asset might experience a pause or a reversal. In this article, I will share straightforward insights on how I mastered the identification and application of these levels in trading.

What Are Support and Resistance Levels?

Support levels are prices where an asset tends to stop falling and potentially bounce back upward. This occurs because demand is thought to be strong enough to prevent the price from declining further. Conversely, resistance levels are prices where an asset tends to stop rising and may reverse downward due to selling pressure or a lack of further buying interest.

The Importance of Identifying Key Levels

Recognizing these key levels is crucial because they can serve as potential entry or exit points. They help traders make informed decisions on placing stop-loss orders and setting price targets. Mastering these levels aids in minimizing risks and maximizing potential returns.

Methods for Identifying Support and Resistance

To locate these crucial price levels, I employed several methods:

Historical Data Analysis: By examining past price movements, I was able to identify recurring levels where prices frequently bounced or halted. Understanding patterns of the past can paint a comprehensive picture of future movements, suggesting where an asset’s price is likely to pivot. When charts display repeated behaviors where prices tend to stabilize or bounce off certain levels, they reveal the rhythm of the market cycles, offering clues for future market behavior.

Chart Patterns: Patterns such as double tops, double bottoms, and head and shoulders often indicate resistance and support levels. These patterns emerge because market participants recognize certain performance accomplishments, creating psychological benchmarks that can influence future price movement. Analyzing chart patterns thus allows a trader to hypothesize future behavior, enhancing the precision of trading decisions.

Technical Indicators: Tools like moving averages and trendlines can help pinpoint these levels by smoothing out price data to identify the general direction. These indicators rely on past data to predict future trends, which assists traders in identifying potential points of interest where the market might react based on historical trends. Integrating technical indicators provides an additional layer of validation to other methods, helping to confirm observations drawn from historical data and chart patterns.

Application of Support and Resistance

After identifying key levels, applying them in trading strategies is the next step. Here are some approaches I found effective:

Role Reversal: When a resistance level is breached, it often becomes a new support level and vice versa. Understanding this role reversal helps in anticipating future price actions. This idea of changing roles facilitates the trader’s ability to adjust strategies and expectations when faced with evolving market conditions, thus fostering more adaptive trading practices.

Trading Breakouts: A breakout occurs when the price moves beyond support or resistance levels. Confirming a breakout before making a trade decision can help avoid false signals. Breakouts can present potential trading opportunities if confirmed convincingly, as they may signal new trends thereby allowing traders to capitalize on emerging patterns before the rest of the market. This ability to anticipate and capitalize on these phenomena is a testament to the power of understanding support and resistance levels.

Continuous Learning and Adaptation

Financial markets are dynamic, which means that support and resistance levels can change. Continual analysis and adaptation are crucial. Participating in forums, attending webinars, and engaging with other traders can provide new strategies and insights. It is imperative for traders to regularly refine their methodologies and theories in light of the latest market trends and technological advancements. Collaboration with other market participants can lead to a deeper understanding of the market’s evolving landscape and may inspire the adoption of novel tactics or tools.

Conclusion

The process of mastering support and resistance levels requires patience and continuous practice. By employing a combination of historical analysis, chart patterns, and technical indicators, these levels can be effectively integrated into a trading strategy. For further reading on this topic, consider exploring more specialized resources and forums that provide detailed guidance and community support suited to various trading experiences. As a trader gathers experience and builds sophistication in their analysis, the relevance of support and resistance levels becomes even more apparent, revealing increasingly subtle nuances that drive market behavior. The consistent success in applying these concepts comes from a diligent process of observation, reflection, and adaptation, underpinning a robust framework for achieving nuanced market insights and potential profitability.

The Fundamental News Event That Wiped Out My Profits

Understanding the Impact of Key News Events on Investments

In the world of investing, staying informed about global news and events is crucial. A single news release can dramatically impact the stock market, influencing stock prices and, consequently, investors’ portfolios. This article will explore how a particular fundamental news event can erase significant profits, providing a factual overview without emotional overtones.

The News Event

Fundamental news events typically involve significant announcements that affect the economic landscape. These can include interest rate changes announced by central banks, geopolitical tensions, new government policies, or corporate earnings reports. For the purpose of this exploration, let us delve deeper into the scenario where a major central bank, such as the U.S. Federal Reserve, announced an unexpected interest rate hike.

How Interest Rate Changes Impact Investments

Interest rates are a crucial tool in a central bank’s monetary policy arsenal. When a central bank unexpectedly raises interest rates, it often signals an attempt to curb inflation. Higher interest rates can lead to reduced consumer spending and increased borrowing costs for businesses. For investors, this news can have several implications.

Bond Market: Interest rate hikes usually lead to a decline in bond prices as new bonds with higher interest returns are more attractive to investors. If an investor is holding existing bonds, the value of those bonds may decrease. This happens because the fixed interest payments on existing bonds become less competitive when new bonds offer better returns.

Stock Market: In the stock market, the implications are multifaceted. Increased borrowing costs can impact corporate profits, causing a decline in stock prices. This can particularly affect companies with high levels of debt as their interest expenses increase, squeezing their profit margins. Additionally, consumer spending may decline as loans become more expensive and disposable income diminishes, further impacting companies that rely heavily on consumer purchases.

Currency Values: As interest rates rise, the domestic currency often appreciates relative to other currencies. For example, a hike in U.S. interest rates can make the dollar stronger against other currencies. This currency appreciation can pose challenges for multinational companies when they convert foreign earnings back to the stronger domestic currency, potentially reducing their overall profitability.

The Immediate Aftermath

When the aforementioned interest rate hike was announced, the reaction in the markets was almost instantaneous. Stock prices began to fall across various sectors, particularly affecting companies sensitive to interest rate changes, such as those in the tech and real estate sectors. Additionally, bond prices dropped sharply, affecting portfolios heavily invested in fixed income securities. This quick and decisive market response underscores the importance of agility and informed decision-making in investment strategies.

An Example Scenario

Consider an investor with a diversified portfolio containing technology stocks, bonds, and some foreign currencies. With the central bank’s rate increase, tech stock prices decline due to anticipated lower future earnings. Investors expect many technology companies to experience reduced profit margins due to the increased cost of borrowing for expansion and maintaining operations. Simultaneously, bonds in the portfolio decrease in value as new bonds promise better returns at higher rates. In this context, the investor’s objective might shift from seeking new investments to strategically managing losses.

Moreover, if the investor holds foreign currency assets, the value of these assets might appear less attractive compared to the appreciating domestic currency, which in this scenario is the U.S. dollar. As a result, the investor may face currency conversion losses when repatriating foreign profits or liquidating foreign-held assets.

Long-term Considerations

While the immediate effects of such fundamental news can be adverse, long-term investors might approach these changes differently. Some investors might view the market dip as an opportunity to buy undervalued stocks, anticipating that the companies will regain their value as the market stabilizes in the future. Historically, market corrections often provide fertile ground for investors with a stronger risk appetite and a long-term investment outlook.

Other investors, focused on short-term profits, may incur losses if they react hastily to the initial market shock. Market timing, while potentially profitable, can also prove to be quite risky. But for well-prepared long-term investors, understanding historical market cycles and the deeper economic implications behind interest rate moves can be advantageous.

Moreover, investors need to consider the broader economic landscape, including how inflation trends and economic growth prospects might evolve following an interest rate hike. Understanding these factors can help investors recalibrate their portfolios to align with new economic realities, ensuring their investments remain resilient despite fundamental shifts in the monetary environment.

Conclusion

The impact of fundamental news events on investments is profound and multifaceted. Investors must stay informed and understand how such news can impact various sectors and asset classes. While profits can be wiped out by unexpected announcements, a well-considered and diversified investment strategy can help mitigate long-term risks.

Ultimately, it is crucial for investors to build a robust strategy that includes setting clear investment objectives, conducting thorough market analysis, and maintaining a diversified portfolio. These strategies can help investors navigate the volatility caused by fundamental news events, minimizing potential losses and capitalizing on new opportunities.

For more information on how you can stay ahead of market news, check reliable financial news outlets such as Bloomberg or Financial Times.

By understanding the nature of fundamental news events and their potential impact, investors can develop strategies that allow them to respond effectively and strengthen their portfolios against market uncertainties. Through continuous learning and adaptation, investors can enhance their ability to manage market shifts with greater precision, ensuring their financial goals remain within reach.

Why I Switched From Technical Analysis to Price Action Trading

Introduction

In the realm of financial markets, methodologies abound that seek to predict future price movements. Among these, technical analysis and price action trading stand out due to their widespread use and distinct approaches. Although both methodologies aim to forecast market behavior, each employs fundamentally different strategies. My own journey in the trading world led me from the structured environment of technical analysis to the more dynamic and straightforward realm of price action trading. This article delves into the reasons for that shift and sheds light on the defining characteristics of these two approaches.

Understanding Technical Analysis

Technical analysis is a methodological approach that relies heavily on historical price data, chart patterns, and an array of technical indicators to make informed judgments about market movements. Popular tools in technical analysis include moving averages, the Relative Strength Index (RSI), and Bollinger Bands. These tools, among others, are utilized to identify trends and patterns that can suggest future price directions. The theory behind technical analysis posits that all information is reflected in historical prices, that prices move in trends, and that history tends to repeat itself, often in recognizable patterns.

Limitations of Technical Analysis

While technical analysis provides a well-structured methodology for trading, it is not without challenges and drawbacks. One significant limitation is its reliance on historical data, which is not always a reliable predictor of future market conditions. Market dynamics are influenced by numerous variables, some of which are unforeseeable and can render historical data inadequate or misleading.

Moreover, the wide array of technical indicators available can overwhelm traders. The resultant indicator overload can lead to decision-making paralysis, causing confusion and indecision rather than clarity and actionable insights.

Lagging Indicators

A particular disadvantage of many technical indicators is their lagging nature. These indicators base their signals on past price movements, meaning they often trigger after a trend or price movement has already commenced. This inherent delay can cause traders to miss lucrative opportunities or make poorly timed entries and exits, particularly in fast-moving markets where timeliness is crucial.

Transitioning to Price Action Trading

In contrast to the complex and indicator-heavy nature of technical analysis, price action trading offers a more streamlined and direct methodology. Price action trading focuses solely on the movement of prices, interpreting these movements to make informed decisions. Instead of relying on an array of indicators, price action traders analyze individual candlesticks, chart patterns, and other market behaviors in real-time. This approach allows traders to respond dynamically and immediately to market movements.

Benefits of Price Action Trading

Simplicity: One of the most compelling advantages of price action trading is its simplicity. By dismissing the need for multiple indicators, traders can direct their attention towards understanding the intricacies of price patterns without the noise of conflicting signals. This focus can often result in clearer decision-making paths.

Real-Time Insights: Price action trading furnishes traders with real-time insights into market sentiment. Through candlestick formations such as pin bars and engulfing candles, traders can derive immediate signals for market entries and exits. This immediacy can enhance a trader’s ability to act swiftly and decisively.

Flexibility: The inherent flexibility of price action trading is another significant benefit. It can be adapted across different time frames and market conditions, making it suitable for both short-term day traders and long-term investors. The adaptability of price action ensures that traders can tailor their strategies to fit their individual circumstances and goals.

Conclusion

The decision to transition from technical analysis to price action trading was predicated on the pursuit of clarity, immediacy, and a more simplified trading approach. Each of these methodologies has its own set of merits; however, for me, price action trading offers a more direct and less cluttered method of engaging with the market. This approach can be particularly beneficial for traders seeking to reduce the complexities associated with technical indicators.

For individuals interested in delving deeper into the world of price action trading, numerous resources and training programs are available. These can help traders effectively utilize candlestick patterns and chart formations. Engaging with dedicated courses or seeking expert analysis can provide valuable insights and accelerate the mastery of price action trading techniques. Understanding this approach can serve as a worthwhile journey for those aiming to navigate the financial markets with greater efficiency and efficacy.