How to Build a Journal Workflow for Pre-Market and Post-Market Notes

Understanding the Importance of a Journal Workflow

Developing a structured journal workflow for pre-market and post-market notes is a foundational practice for traders and investors who seek consistency, accountability, and measurable improvement. Financial markets generate a vast quantity of information each day, ranging from macroeconomic data releases to company-specific announcements and price fluctuations across global exchanges. Without an organized method of capturing and reviewing this information, it becomes difficult to distinguish between random outcomes and repeatable strategies.

A journal workflow introduces discipline into the trading process. Rather than reacting impulsively to price movements, traders who document their preparation, reasoning, and outcomes create a record that allows for objective evaluation. Over time, this record becomes a database of decisions, assumptions, and results. Patterns begin to emerge, revealing strengths and exposing weaknesses. The journal thus moves beyond simple note-taking and becomes an analytical tool.

A structured workflow also enhances accountability. By formally documenting trade ideas before execution and evaluating them afterward, traders reduce hindsight bias. It is easy to reinterpret decisions after outcomes are known, but a time-stamped journal preserves the original thought process. This transparency helps distinguish between trades that followed a strategy and those that deviated from established guidelines.

In addition, a well-designed journal workflow supports risk management. Traders who outline risk parameters during pre-market preparation and compare them with actual execution can identify inconsistencies. For example, if repeated entries show that stops were moved or position sizes were increased without clear justification, this information signals areas requiring procedural adjustment.

The value of a journal compounds over time. Individual entries may seem routine, but months of structured observations create a detailed performance history. This long-term dataset provides insights that cannot be derived from isolated trading days. Consequently, establishing a journal workflow should be regarded as a core operational component rather than an optional supplement.

Defining a Structured Workflow

Before examining the practical elements of pre-market and post-market notes, it is useful to clarify what is meant by a structured workflow. A workflow refers to a consistent sequence of steps followed before and after market activity. Structure implies that the same categories of information are recorded regularly, in a standardized format, so they can be evaluated over time.

Consistency is the primary objective. A workflow that changes daily undermines the ability to compare data across sessions. Therefore, traders should determine in advance which metrics, analyses, and reflections will be included in each entry. Templates are often helpful in maintaining this uniformity.

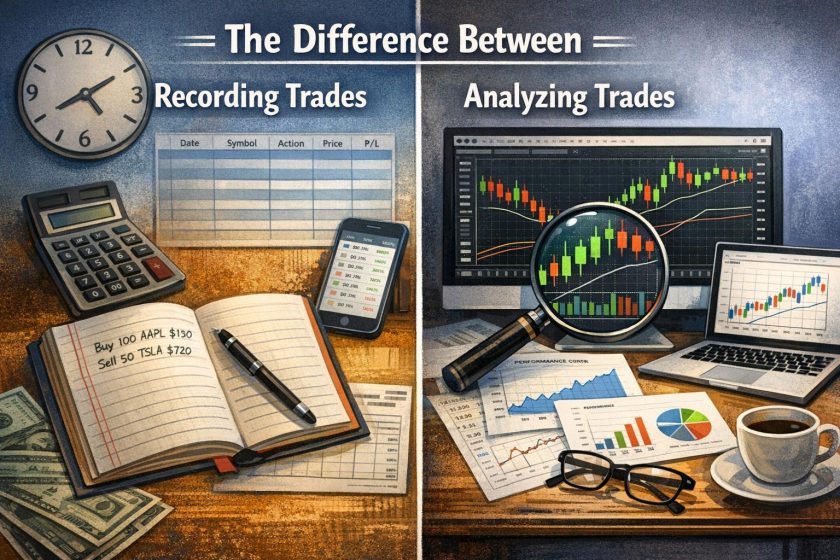
A comprehensive workflow typically includes three phases: preparation, execution tracking, and review. While execution may not always be written about in real time, it is indirectly documented through order logs, screenshots, and performance statistics. Preparation and review, on the other hand, rely heavily on deliberate note-taking.

By separating these phases clearly, traders can assess not only outcomes but also process quality. A profitable day does not necessarily indicate effective preparation, just as a losing day does not automatically reflect flawed analysis. The journal helps differentiate between process adherence and performance variance.

Essential Components of Pre-Market Notes

Pre-market preparation establishes the framework for the trading session. It transforms generalized awareness into a structured plan. Although markets are inherently uncertain, preparing systematically reduces unnecessary variability in decision-making.

Market Overview

A pre-market journal entry typically begins with a comprehensive market overview. This section captures the current state of global and domestic markets. Reviewing major indices provides context that influences sector performance and individual securities.

Traders often start by examining overnight developments in Asian and European markets. If global indices have experienced significant movement, this may affect domestic market sentiment. Understanding whether markets are trending upward, downward, or consolidating informs expectations regarding volatility and liquidity.

In addition to index performance, it is useful to note movements in related asset classes such as bonds, commodities, and currencies. For instance, rising bond yields may signal shifts in interest rate expectations, which can affect equity valuations. Commodity price changes may influence sectors such as energy or materials. Recording these observations ensures that trades are not evaluated in isolation from the broader environment.

The goal of the market overview is not to predict precise outcomes but to establish context. Context shapes probability assessments and clarifies whether strategies should be more defensive or more aggressive.

Economic Calendar Events

Another critical component of pre-market notes involves reviewing scheduled economic events. Markets frequently react to data releases such as employment reports, inflation statistics, manufacturing indices, and central bank decisions. A trader unaware of these events may misinterpret volatility as technical or sentiment-driven when it is actually news-based.

Documenting the economic calendar aligns expectations with potential catalysts. For each significant event, traders can note the consensus forecast, prior readings, and the anticipated release time. This preparation allows for strategic positioning, whether by reducing exposure ahead of high-impact announcements or planning trades that capitalize on volatility.

The relevance of economic data varies by trading style. Short-term traders may be particularly sensitive to intraday releases, while long-term investors may focus on broader macroeconomic trends. Regardless of timeframe, recording these events in the journal ensures that no major catalyst is overlooked.

Furthermore, comparing anticipated reactions with actual market responses during post-market review offers valuable insight. Sometimes markets respond more strongly than expected, suggesting heightened sensitivity. At other times, muted reactions may indicate that information was already priced in.

Key Stocks Analysis

Pre-market notes also include focused analysis of individual securities. This section typically prioritizes stocks currently held in the portfolio as well as those under consideration for new positions.

For portfolio holdings, traders should record the prevailing trend, recent news, and any technical developments that may influence the day’s strategy. Earnings reports, regulatory filings, and sector-specific updates can significantly alter outlooks. Documenting such information ensures that decisions are based on current data rather than outdated assumptions.

For prospective trades, analysis should include a clear rationale. This may involve identifying breakout patterns, support and resistance levels, or fundamental catalysts. The journal should articulate why the stock is being monitored, what conditions would trigger entry, and what would invalidate the setup.

Precise documentation of planned entry points, stop levels, and position sizes reinforces disciplined execution. When these elements are defined before the market opens, impulsive adjustments become easier to identify during review.

Technical and Sentiment Analysis

Incorporating technical indicators and sentiment measures provides an additional layer of analytical rigor. Charts can reveal patterns not immediately evident through price inspection alone. Moving averages, trend lines, volume indicators, and oscillators such as the relative strength index offer structured ways to interpret price behavior.

Pre-market notes may include observations about trend direction, volatility expansion, or compression patterns that suggest imminent movement. Support and resistance levels should be clearly defined, as they often serve as reference points for trade management.

Sentiment analysis complements technical tools. Indicators such as put-call ratios, volatility indices, or survey-based measures provide insight into prevailing market psychology. Extreme readings may suggest overbought or oversold conditions. Recording these metrics helps traders evaluate whether the market is aligned with or deviating from their expectations.

The objective is to integrate these analyses into a coherent plan. Rather than documenting indicators mechanically, traders should explain how the data influences potential actions. Clarity in pre-market notes directly contributes to accountability during the post-market phase.

Execution Documentation During the Trading Day

Although the primary focus of journaling lies in pre-market and post-market entries, execution documentation during the session is equally important. This does not necessarily require narrative writing in real time, but supporting data should be captured systematically.

Screenshots of chart setups at entry and exit points provide visual context. Order confirmations and performance metrics record quantitative results. Short annotations explaining why an entry was taken or why a stop was moved can be extremely valuable during review.

Without execution documentation, it becomes difficult to evaluate whether performance outcomes were aligned with the original plan. Even the most comprehensive pre-market analysis loses value if execution details are not preserved.

Designing a Post-Market Review

The post-market review transforms daily activity into structured learning. While pre-market preparation focuses on planning, post-market reflection concentrates on evaluation.

Performance Assessment

The first element of a post-market review typically involves assessing performance relative to planned strategies. Traders should compare actual trades with their documented setups. Were entry criteria followed? Were exits executed according to predefined risk parameters?

This evaluation requires separating outcome quality from process quality. A trade that results in a loss but adheres strictly to plan may still represent effective execution. Conversely, a profitable trade that ignored established guidelines introduces inconsistency that may not be sustainable over time.

Quantitative metrics such as win rate, average gain, average loss, and risk-reward ratio can be recorded daily or summarized weekly. Including these statistics in the journal creates a measurable record of progress. Tracking metrics ensures that improvement efforts are based on data rather than subjective impressions.

Market Analysis Reflection

The post-market phase should also revisit the broader market overview recorded in the morning. Comparing anticipated developments with actual price movements highlights analytical accuracy.

If market behavior deviated significantly from expectations, the journal entry should explore potential reasons. Were economic data releases stronger or weaker than forecast? Did unexpected news alter sector dynamics? Identifying discrepancies improves future forecasting and enhances adaptability.

This reflection process helps prevent overconfidence. Even well-researched analyses can be incorrect. Documenting both accurate and inaccurate assessments develops a balanced perspective and encourages continuous refinement of analytical methods.

Emotional and Psychological Insights

Trading decisions are influenced not only by data but also by psychological factors. Although maintaining objectivity is the goal, fluctuations in performance can affect concentration and risk tolerance. Including a measured assessment of emotional state in the journal provides insight into behavioral patterns.

Rather than employing dramatic language, traders can describe specific observations. For example, noting impatience after a series of small losses or increased caution following a large gain allows for pattern recognition. Over time, this information may reveal correlations between emotional states and performance outcomes.

These observations should be factual and concise. The purpose is not introspection for its own sake but identification of variables that influence decision quality. When recurring psychological patterns are identified, strategies such as position size adjustments or scheduled breaks can be implemented.

Implementing the Journal in a Digital Environment

Modern trading activity often relies on digital platforms, making a digital journal a practical choice. Applications such as OneNote, Evernote, or specialized trading journal software provide organizational flexibility and search functionality.

Consistent Structuring

Digital templates ensure consistency. Pre-market and post-market sections can be standardized with predefined headers. This structure reduces the likelihood of omitting important information and enables efficient comparison across dates.

Over time, traders may refine their templates based on experience. However, changes should be deliberate and documented to preserve comparability. Stability in structure strengthens the analytical value of the journal.

Attach Supporting Data

One significant advantage of digital journaling is the ability to attach supporting material. Charts, screenshots, performance summaries, and spreadsheets can be incorporated directly into entries. Visual records provide clarity when reviewing historical trades.

Documentation should be organized logically, with clear file naming conventions and chronological sorting. Efficient organization reduces friction during weekly or monthly reviews and encourages consistent use of the journal.

Regular Reviews

A journal’s long-term value depends on periodic analysis. Weekly reviews allow traders to identify short-term patterns, while monthly or quarterly summaries highlight broader trends. These reviews can examine metrics such as average risk-reward ratio, frequency of rule violations, and sector performance distribution.

For further insights on financial trading strategies, consider checking our detailed articles on financial strategies.

Regular review sessions convert raw notes into actionable insights. Without this step, journaling may become a passive record rather than an active improvement tool.

Integrating the Journal into a Broader Trading Framework

A journal workflow should not function independently of a broader trading plan. Instead, it acts as a monitoring and feedback mechanism. The trading plan defines strategy parameters, risk management guidelines, and performance targets. The journal evaluates adherence to that plan.

When discrepancies arise between documented behavior and established rules, adjustments can be implemented systematically. For example, if journal entries repeatedly show inconsistent position sizing, the trading plan may require clearer definitions or automated controls.

Institutional traders often operate within structured reporting environments that mirror personal journaling practices. Retail traders can achieve similar analytical rigor by maintaining detailed records and conducting regular reviews. In this way, journaling bridges the gap between informal trading and professional-grade process management.

Conclusion

Building and maintaining an effective journal workflow for pre-market and post-market notes is a structured, data-driven approach to improving trading performance. By documenting market overviews, economic events, individual stock analysis, and technical indicators before the session begins, traders create a clear operational plan. Through systematic post-market review, they evaluate adherence to that plan, assess performance metrics, and identify behavioral patterns.

Over time, the journal evolves into a comprehensive record of decision-making processes and outcomes. This record supports objective analysis, disciplined risk management, and continuous improvement. When implemented consistently and reviewed regularly, a journal workflow becomes an integral component of responsible trading and informed investment management.

The Difference Between Recording Trades and Analyzing Trades

Understanding the Distinction Between Recording and Analyzing Trades

In the realm of trading, two fundamental activities often become intertwined in practice: recording trades and analyzing trades. Although closely connected, they serve distinct purposes within a trader’s development and operational framework. Recording trades focuses on the structured documentation of transactional data, while analyzing trades centers on interpreting that data to refine decision-making and improve performance. Confusion between these processes can hinder a trader’s growth, as each requires a different mindset, set of tools, and level of engagement.

A clear understanding of how recording and analysis differ—and how they complement one another—creates a foundation for disciplined and systematic trading. The distinction is not merely procedural; it reflects two separate stages in a feedback cycle that supports consistency, accountability, and strategic evolution.

Recording Trades

Recording trades refers to the consistent documentation of every executed transaction. The process is primarily administrative, yet it forms the structural backbone of a professional trading approach. When traders record trades carefully, they build a comprehensive dataset that enables objective review at a later stage.

A properly maintained trading journal generally includes factual information such as the date and time of entry and exit, the asset or instrument traded, the position size, the entry and exit prices, the stop-loss and take-profit levels if applicable, and the final outcome expressed in profit, loss, or percentage return. Additional contextual details may also be included, such as prevailing market conditions, the strategy used, timeframe alignment, or any deviations from a predefined trading plan. Some traders also note subjective observations, including confidence levels or perceived external influences.

The key characteristic of recording is neutrality. At this stage, the trader does not interpret, justify, or critique decisions. The goal is to capture what occurred, not to explain why it happened or whether it was effective. This distinction is essential because introducing interpretation during recording may compromise objectivity. The journal serves as raw data, and its reliability depends on accurate, consistent, and timely entries.

Another defining element of effective trade recording is standardization. When the same format is used for every trade, comparison across time becomes feasible. Uniform data fields allow for pattern recognition during the analysis phase. Inconsistent or incomplete records limit the ability to draw meaningful conclusions later.

Timing also matters. Trade details should be recorded immediately after execution or closure. Delayed entry increases the risk of missing information or distorting details due to memory bias. In fast-moving markets, relying on recollection even a few hours later can reduce accuracy.

The Importance of Consistent Trade Recording

Consistency in recording trades is not optional for traders who aim to improve systematically. A comprehensive record establishes accountability and acts as a performance archive. Over weeks, months, and years, this archive grows into a personal dataset reflecting real behavior under live conditions.

Without consistent documentation, traders are limited to selective memory. Human recall often emphasizes recent outcomes or especially favorable results, which can distort perception. Recording every trade, regardless of outcome, prevents selective bias from influencing future decisions.

Trade recording also provides transparency. In professional settings, such as proprietary trading firms or managed accounts, maintaining thorough records is part of compliance and performance evaluation protocols. Even independent traders benefit from this transparency because it enables objective self-assessment.

Furthermore, consistent logs allow for performance benchmarking. Traders can compare different time periods, strategies, asset classes, or market conditions. For example, they may discover that performance is stronger during trending environments than during range-bound markets. However, this insight becomes available only if relevant data points were captured at the recording stage.

Another advantage lies in identifying deviations from a trading plan. By documenting the specific setup or strategy used in each trade, it becomes possible to measure adherence to rules. If rule-breaking occurs frequently, the data will reveal it. Without such records, it may be difficult to determine whether underperformance stems from strategy limitations or inconsistent execution.

It is important to note that recording trades is not inherently analytical. While a trader might briefly note subjective observations, these entries remain descriptive rather than evaluative. Their true value emerges during the next stage: analysis.

Analyzing Trades

In contrast to recording, analyzing trades involves interpreting the collected data to identify strengths, weaknesses, patterns, and structural tendencies within a trading approach. Analysis transforms raw transactional records into actionable insights.

Where recording answers the question “What happened?”, analysis asks “Why did it happen?” and “What does it imply?” This shift represents a move from documentation to evaluation.

Trade analysis often begins with calculating performance metrics. These may include win rates, average gain versus average loss, expectancy, drawdown levels, risk-to-reward ratios, and overall profitability. However, analysis extends beyond numeric summaries. It also involves examining trade selection, timing accuracy, market context, and psychological consistency.

One of the primary purposes of analysis is to determine whether a strategy has a positive expectancy over a statistically meaningful sample size. Individual trades have limited informational value; patterns across dozens or hundreds of trades reveal structural characteristics. By evaluating aggregated data, traders can determine whether a method produces consistent returns relative to risk.

Another dimension of analysis concerns risk management. Even profitable strategies can underperform if position sizing is inconsistent or if risk exposure exceeds predefined limits. Through reviewing multiple trades, a trader may discover, for instance, that losses escalate when deviating from predefined stop-loss rules or when increasing trade size during periods of volatility.

Psychological factors also become visible during analysis. Patterns such as premature exits, hesitation in executing valid setups, or impulsive entries outside of strategy parameters can be identified only after systematic review. Recording makes these behaviors visible; analysis interprets their consequences.

Key Aspects of Trade Analysis

Trade analysis generally examines both quantitative and qualitative aspects of performance. Quantitative evaluation focuses on data aggregation and measurement. This includes calculating risk-adjusted returns, determining consistency across timeframes, and assessing variance in results. By comparing these metrics against defined benchmarks, traders can measure progress objectively.

Qualitative analysis evaluates decision-making processes. This involves reviewing screenshots of charts at entry and exit points, assessing alignment with predefined criteria, and examining contextual factors such as broader market trends or macroeconomic events. While quantitative metrics reveal outcomes, qualitative evaluation reveals process integrity.

Another important aspect is segmentation. Traders often analyze trades according to categories such as asset class, time of day, volatility conditions, or strategy type. Segmenting data enables more precise insights. For example, a trader may find that a breakout strategy performs well in high-volume sessions but underperforms during low-liquidity periods. Without segmented analysis, such patterns may remain concealed within aggregate results.

The evaluation of win/loss ratios must also be contextualized. A high win rate does not necessarily indicate profitability if average losses exceed average gains. Conversely, a lower win rate strategy may remain profitable if gains significantly outweigh losses. Analysis clarifies these relationships through statistical measurement rather than intuition.

Risk concentration is another focal point. Reviewing consecutive losses, drawdown periods, and maximum exposure levels allows traders to assess whether their capital allocation model supports long-term sustainability. This stage often leads to adjustments in position sizing or diversification.

Importantly, analysis should occur at predefined intervals rather than impulsively after each trade. Reviewing too frequently may prompt premature modifications to a system that requires a larger sample to demonstrate validity. Structured review cycles—such as weekly or monthly evaluations—encourage disciplined assessment.

The Role of Technology in Trade Analysis

Modern trading environments provide substantial technological support for both recording and analyzing trades. Many brokerage platforms automatically log executed transactions, reducing the manual burden of data entry. However, automated records alone are often insufficient for comprehensive analysis. Traders may need to export data into specialized software or custom spreadsheets to calculate advanced metrics.

Data visualization tools contribute significantly to analytical clarity. Equity curves, drawdown charts, distribution graphs of returns, and expectancy models help translate abstract numbers into interpretable patterns. Visualization reduces cognitive load and facilitates comparative analysis across time periods.

Algorithmic tools can further enhance analysis by backtesting strategies on historical data. Backtesting complements forward-recorded results, offering insight into how a strategy might perform under varied market conditions. Nevertheless, backtested outcomes should be interpreted cautiously and compared against live-trading records to assess consistency.

Some platforms integrate tagging systems that allow traders to label trades according to setup type or market condition. These categorizations streamline segmented analysis. For example, filtering trades by a specific tag can instantly reveal average performance metrics for that subset.

Artificial intelligence and machine learning applications are increasingly capable of identifying correlations across large datasets. While such tools offer advanced capabilities, their effectiveness depends on the quality and completeness of recorded data. Inaccurate or inconsistent logs limit analytical reliability, regardless of technological sophistication.

Despite these advancements, technology does not replace critical thinking. Analytical outputs must be interpreted within the context of a trader’s objectives, risk tolerance, and strategic framework. Automated metrics provide information, but strategic refinement requires informed judgment.

Integrating Recording and Analysis into a Structured Process

Although recording and analyzing trades are distinct functions, their effectiveness depends on coordination. Recording creates the dataset; analysis extracts value from it. If recording is inconsistent, analysis becomes unreliable. If analysis is neglected, recording becomes an administrative exercise without practical benefit.

An effective trading workflow typically separates execution from evaluation. During live trading hours, the focus remains on adhering to predefined rules and documenting each action. Analytical review occurs outside active market engagement to prevent interference with decision-making.

Establishing structured review cycles enhances coherence between these processes. For example, traders may conduct brief daily reviews to ensure accurate documentation, followed by comprehensive weekly evaluations focusing on metrics and strategy assessment. Monthly or quarterly reviews can address higher-level performance trends and capital allocation considerations.

This cyclical framework supports continuous improvement without encouraging reactive behavior. Adjustments to strategy should be based on statistically meaningful evidence rather than isolated outcomes. Recording provides the evidence; analysis determines whether adjustments are warranted.

Common Misconceptions About Recording and Analyzing

A frequent misconception is that detailed recording alone constitutes analysis. Simply maintaining extensive logs does not inherently improve trading performance. Without structured evaluation, data remains dormant.

Another misunderstanding is that analysis should focus exclusively on losing trades. While assessing losses is important for identifying risk management issues or execution errors, reviewing successful trades is equally essential. Profitable trades can reveal strengths worth reinforcing or replicating.

Some traders believe that automated brokerage reports eliminate the need for personal journals. While brokerage statements provide transactional details, they rarely include contextual insights such as strategic rationale or market condition tags. Personal documentation supplements these reports with qualitative data necessary for comprehensive analysis.

There is also a tendency to overanalyze small sample sizes. Drawing conclusions from a limited number of trades may lead to premature strategy modifications. Statistical relevance requires sufficient data collected over varied conditions. Disciplined recording supports the accumulation of this data, while measured analysis protects against impulsive conclusions.

Practical Implications for Strategy Development

The distinction between recording and analyzing trades influences how strategies evolve over time. A trader seeking to refine an approach must rely on empirical evidence derived from consistent logs. For example, suppose a trader suspects that tightening stop-loss levels might improve risk-adjusted returns. Rather than making speculative changes, analysis of historical records can reveal how similar adjustments affected performance in the past.

Strategic refinement becomes systematic when guided by data. Recording ensures that experimentation is measurable. Analysis evaluates the outcome of those experiments. If changes produce statistically significant improvement, they may be incorporated permanently; if not, they can be reversed.

Long-term development depends on this iterative cycle. Traders who separate documentation from evaluation maintain clarity in both execution and refinement. The process resembles scientific methodology: gather data, analyze results, adjust hypotheses, and test again.

Conclusion

In summary, recording trades and analyzing trades represent two distinct yet interdependent phases of the trading process. Recording focuses on structured, consistent documentation of factual information. It establishes accountability, reduces memory bias, and creates the dataset necessary for evaluation. Analyzing trades transforms that dataset into insights by examining statistical performance, risk management effectiveness, behavioral tendencies, and strategic alignment.

Recording answers what occurred. Analysis explains why it occurred and what adjustments may improve outcomes. Together, these activities form a disciplined feedback system that supports systematic growth. Traders who master both processes enhance their ability to evaluate performance objectively, refine strategies responsibly, and maintain consistency over extended periods.

How to Tag Trades in a Journal to Find Performance Patterns

Introduction to Trade Tagging

In trading, maintaining a detailed journal is one of the most practical methods for evaluating performance and refining decision-making. While recording entry and exit points is useful, raw trade logs alone often fail to explain why specific outcomes occurred. Trade tagging introduces structure into the journaling process by assigning descriptive labels to trades based on predefined criteria. These labels transform a simple record into an analytical dataset.

Trade tagging is the practice of categorizing trades according to characteristics such as setup type, market environment, time of execution, risk profile, or psychological state. Instead of reviewing trades individually, traders can group similar trades and analyze them collectively. This systematic approach improves clarity when assessing performance and helps isolate variables that influence results.

Without a tagging framework, traders may rely on memory or subjective impressions to evaluate performance. Structured tagging reduces this subjectivity and makes performance measurement more data-driven. Over time, a tagged journal becomes a structured database capable of supporting meaningful statistical conclusions.

Why Tagging Is Important

Tagging trades provides a comprehensive overview of trading behavior. It enables traders to classify performance across multiple dimensions rather than evaluating outcomes in isolation. A winning trade does not necessarily indicate strong execution, and a losing trade does not automatically signal a flawed strategy. Tags add context that clarifies what actually occurred.

For example, a trader may discover that breakout trades perform consistently in trending markets but underperform in sideways conditions. Without tagged data, this distinction might remain unnoticed. By categorizing trades by market condition and setup type, these performance differences become measurable.

Tagging also strengthens accountability. When traders record aspects such as rule adherence or deviations from strategy, patterns of discipline emerge. This creates a clearer picture of behavioral tendencies and encourages structured improvement. Over time, tagged records allow for more precise adjustments to trading plans.

Additionally, tagging supports risk management review. By labeling trades according to risk size, volatility conditions, or account exposure, traders can evaluate how risk allocation correlates with long-term outcomes. This is especially relevant when scaling strategies or adjusting position sizing models.

Basic Principles of Trade Tagging

An effective tagging system is built upon clarity and structure. Without defined standards, tags can become inconsistent and unreliable, which undermines analysis.

Consistency: Traders should establish a standardized list of tags and definitions before applying them. If one trade is labeled “Breakout” and another similar trade is labeled “Range Break,” inconsistencies can distort performance comparisons. Written definitions help eliminate ambiguity and ensure that tags are applied uniformly over time.

Relevance: Every tag should serve a specific analytical purpose. Adding excessive or redundant labels complicates evaluation and reduces clarity. For instance, if a trader does not use volume analysis in decision-making, tagging volume spikes may add unnecessary complexity.

Simplicity: A tagging system does not need to be overly complex to be effective. Beginning with a manageable number of categories ensures accuracy and sustainability. Additional layers can be introduced gradually as analysis requirements evolve.

Objectivity: Tags should describe observable conditions rather than subjective interpretations. Instead of labeling a trade as “Good Idea,” it is more useful to label it according to quantifiable criteria such as “Pullback to 20 MA in Uptrend.”

Clear documentation of tagging criteria helps maintain statistical integrity in long-term analysis.

Common Tag Categories

Organizing trades into logical categories allows for structured comparison. Several widely used categories form the foundation of many trading journals.

Market Conditions: Market context significantly affects performance. Tagging trades as occurring in bull markets, bear markets, high-volatility environments, low-volatility conditions, or range-bound periods helps identify where a strategy performs best. Traders who operate in multiple asset classes may also distinguish between equities, futures, forex, or digital assets.

Trade Setups: Setup classification is fundamental to strategy evaluation. Tags such as breakout, pullback, mean reversion, trend continuation, range rejection, or news reaction identify the underlying strategy logic. Over time, traders can calculate metrics such as win rate, average return, and drawdown per setup type.

Psychological State: Emotional context influences execution. Tags indicating conditions such as calm, distracted, fatigued, overconfident, or hesitant provide measurable insight into behavioral consistency. When psychological tags are analyzed alongside results, traders may identify correlations between mental state and performance.

Execution Quality: Trades can be tagged according to adherence to plan. Designations such as “Rule-Followed,” “Early Entry,” “Late Entry,” or “Improper Stop Placement” help distinguish performance due to strategy effectiveness from performance affected by execution errors.

Trade Duration: Distinguishing between scalps, intraday trades, swing trades, and position trades clarifies how time horizon influences results. This is valuable for traders experimenting with multiple timeframes.

Structured categories allow performance reports to move beyond simple profit and loss summaries toward more meaningful insights.

Advanced Tagging Techniques

As a trader’s analytical framework matures, additional layers of tagging can refine insight.

Time-Based Tags: Performance can vary significantly depending on execution timing. Tags such as pre-market, market open, midday session, closing hour, or overnight hold enable traders to isolate time-of-day effects. Some traders discover that volatility during the first trading hour aligns more effectively with breakout strategies, while quieter midday sessions suit mean reversion approaches.

Risk Level: Trades may be labeled as low, medium, or high risk based on position size relative to account equity or based on stop-loss distance. Analyzing performance by risk classification can reveal whether higher risk exposure produces proportionally higher returns or merely increases drawdown volatility.

Technical Indicators: For traders who rely on technical analysis, tagging which indicators informed the decision allows performance evaluation of those tools. Examples include moving averages, RSI divergences, MACD crossovers, Fibonacci retracements, or volume confirmation. This analysis may demonstrate that certain indicators perform better in trending environments compared with consolidating markets.

Fundamental Catalysts: In markets influenced by earnings, economic reports, or macro events, traders may tag trades tied to specific catalysts. This distinction can reveal whether event-driven trades outperform technically driven ones.

Environmental Conditions: Broader contextual tags may include liquidity level, volatility index readings, or correlation with major indices. These environmental layers deepen understanding of system robustness.

Advanced techniques are most effective when built upon a stable foundational tagging structure. Complexity should increase only when data analysis demands it.

Analyzing Tagged Data

Tagging alone does not improve performance; the analytical process that follows creates value. Once trades are categorized consistently, statistical evaluation becomes possible. Data can be exported to spreadsheets or specialized journaling software for analysis.

Metrics such as win rate, expectancy, average risk-to-reward ratio, maximum drawdown, and profit factor can be calculated per tag category. Comparing these metrics across categories reveals areas of strength and weakness.

For example, suppose breakout trades in high-volatility environments produce a positive expectancy while pullback trades during low volatility show negative expectancy. The trader can then consider shifting focus toward favorable conditions rather than applying strategies uniformly across all environments.

Visual representation of tagged data strengthens clarity. Pie charts showing trade distribution by setup, bar graphs comparing average returns, or line charts illustrating equity curves per category make trends easier to interpret.

Longitudinal analysis is equally important. Quarterly or annual reviews of tagged performance help identify whether edge sustainability is improving or deteriorating over time. Market conditions evolve, and tagged data can detect shifts in strategy viability.

Drawing Insights from Data

Comprehensive analysis transforms raw data into actionable information. Several forms of insight typically emerge from structured review.

Pattern Recognition: When trades are grouped by shared attributes, patterns become visible. A trader might discover that breakout setups succeed only when aligned with higher timeframe trends. Alternatively, mean-reversion trades may perform consistently during range-bound market phases.

Strategy Refinement: Tagged performance enables precise adjustments. Instead of discarding an entire strategy after a series of losses, traders can isolate the exact context that contributed to underperformance. Adjustments may involve filtering trades by volatility thresholds, limiting exposure during specific sessions, or modifying entry timing.

Behavioral Adjustment: Emotional and execution tags often reveal recurring discipline challenges. For example, late entries due to hesitation may show reduced profitability compared with rule-followed executions. Recognizing this allows traders to develop targeted corrective measures.

Risk Calibration: Reviewing performance by risk classification may indicate that higher risk allocation does not proportionally increase returns. Position sizing formulas can then be recalibrated for improved stability.

Over time, these incremental improvements compound, leading to a more refined and data-informed trading approach.

Integrating Tagging Into Daily Practice

Consistency in journaling determines effectiveness. Traders should record tags immediately after closing trades to ensure accuracy. Delayed tagging can lead to memory distortions or incomplete context.

Automation can simplify the process. Many platforms allow custom tagging fields or dropdown selections, reducing manual effort. Where automation is unavailable, predefined templates in spreadsheets maintain structure.

Periodic review sessions should be scheduled. Weekly evaluations allow for immediate adjustments, while monthly or quarterly reviews provide broader statistical insight. During these reviews, traders can compare performance across tags, assess compliance with strategy rules, and consider refinements.

Documentation of tagging criteria should evolve cautiously. Modifying tag definitions frequently disrupts long-term comparisons. If adjustments are required, they should be recorded clearly so historical data remains interpretable.

Limitations and Considerations

While tagging enhances analysis, it does not eliminate uncertainty inherent in trading. Statistical significance requires an adequate sample size. Drawing firm conclusions from a limited dataset can produce misleading interpretations.

Confirmation bias is another consideration. Traders may focus selectively on tags that confirm prior beliefs. Objective statistical review helps mitigate this tendency.

Additionally, over-segmentation of data can reduce clarity. Dividing trades into too many narrow categories may result in insufficient sample sizes per tag, limiting meaningful analysis. Balance between granularity and statistical power is essential.

Trade tagging should also complement, not replace, broader performance evaluation metrics. Equity curves, drawdown statistics, and risk-adjusted return measures remain vital components of assessment.

Conclusion

Tagging trades within a journal provides a structured framework for systematic performance analysis. By categorizing trades according to relevant criteria and maintaining consistent definitions, traders create a dataset capable of supporting meaningful statistical evaluation.

Through disciplined analysis of tagged data, patterns become measurable rather than anecdotal. Strategies can be refined with precision, behavioral tendencies can be addressed constructively, and risk management can be calibrated according to evidence rather than assumption.

Over time, a well-maintained tagged journal evolves into a detailed performance archive. It transforms individual trades from isolated events into components of a broader analytical system. By applying structured tagging principles and conducting regular reviews, traders position themselves to make progressively informed decisions grounded in organized data rather than subjective memory.

Weekly Trading Journal Review Framework for Active Traders

Introduction to Weekly Trading Journal Review

For active traders, maintaining a trading journal is a structured method for documenting decisions, outcomes, and observations related to market activity. A weekly review of this journal transforms raw records into actionable insight. Rather than relying on memory or general impressions, traders can base adjustments on documented evidence. This process supports consistency, strengthens analytical thinking, and promotes disciplined execution.

Trading environments evolve continuously. Market volatility, liquidity conditions, macroeconomic developments, and sector performance all shift over time. A weekly review allows traders to assess whether current strategies remain aligned with prevailing conditions. By evaluating trades within a defined timeframe, patterns emerge that may not be visible in daily observation. This structured reflection reduces randomness in decision-making and supports systematic improvement.

A trading journal is not merely a log of profits and losses. It is a detailed account of intent, reasoning, context, and execution. When paired with a rigorous weekly review, it becomes a performance management tool comparable to those used in professional risk management environments. The effectiveness of the journal depends not only on the quality of entries but also on the consistency and depth of the review process.

Benefits of a Trading Journal

A trading journal serves multiple professional and analytical purposes. Through routine documentation, traders create a data set that reflects their behavior over time. This information provides a foundation for objective evaluation.

Performance Analysis: Each recorded trade contributes to a statistically meaningful sample. Over time, traders can analyze entry quality, exit precision, adherence to trading plans, and risk control. Reviewing both successful and unsuccessful trades is critical. A profitable trade executed outside established rules may introduce long-term risk, while a losing trade that followed correct procedure may indicate normal variance rather than error. A journal clarifies these distinctions.

Emotion Management: Markets often react unpredictably, and traders can experience psychological pressure when positions fluctuate. By recording emotional states before, during, and after trades, traders gain measurable insight into behavioral patterns. Emotional documentation may reveal tendencies such as hesitation after losses or overconfidence following consecutive wins. Identifying these trends supports the development of emotional regulation practices grounded in observation rather than assumption.

Strategy Development: A consistent record provides a testing ground for strategic refinement. Traders can compare setups across similar market conditions and measure outcome consistency. For example, breakout strategies may perform effectively during high-volatility periods but underperform in range-bound markets. Without detailed historical documentation, such distinctions are difficult to confirm. A journal enables comparative evaluation and incremental optimization.

Setting Up a Review Framework

A structured review framework ensures that weekly analysis goes beyond a superficial examination of account balance changes. The framework should be standardized so that each review follows a consistent sequence. Standardization improves accuracy and reduces bias.

1. Review of Trades: Begin by examining each trade chronologically within the review period. Identify the rationale for entry, including technical or fundamental signals. Confirm whether the trade met predefined criteria. Then evaluate execution quality: Was the entry price aligned with the plan? Were stop-loss and take-profit levels placed according to risk management rules? The exit decision should also be assessed. Determine whether the closure followed the planned strategy or if it was influenced by emotion or external factors. Chronological analysis helps reveal whether earlier trades influenced subsequent decisions during the week.

2. Statistical Analysis: Quantitative metrics provide an objective measure of performance. At minimum, calculate win-loss ratio, average gain, average loss, total net performance, and risk-to-reward ratios. Additional metrics such as maximum drawdown, expectancy, and profit factor contribute to deeper insight. A weekly summary should also compare current metrics with historical averages. Variations from historical norms may signal evolving market conditions or inconsistencies in strategy execution. Statistical assessment prevents subjective interpretation and centers the review on measurable results.

3. Emotional Assessment: After examining technical and statistical elements, review personal notes concerning mindset and emotional context. Identify instances where hesitation delayed execution or impulse accelerated entry. Evaluate whether fatigue, external stress, or overconfidence influenced trade decisions. Repeated emotional triggers signal areas requiring corrective strategies. Over time, emotional assessment can reveal patterns as consistent as technical signals, enabling proactive adjustments.

A well-designed framework separates analysis into defined sections, reducing the risk of overlooking relevant variables. By following the same structure weekly, traders create comparability across review periods.

Deepening Quantitative Evaluation

Beyond basic statistics, traders may incorporate more detailed quantitative analysis during weekly reviews. Evaluating position sizing consistency ensures that risk remains aligned with overall capital management principles. If certain trades exceed predefined risk limits, the review should examine the reasoning behind such deviations.

Trade duration analysis can also provide insight. Some strategies are time-sensitive, and holding positions beyond their optimal timeframe may reduce effectiveness. Classifying trades by duration and comparing outcomes can highlight mismatches between strategy design and execution.

Instrument-specific analysis is another valuable component. Traders who operate across multiple assets may discover that certain instruments consistently outperform others. A weekly breakdown by asset class, sector, or market condition can highlight areas of comparative advantage. Concentrating effort on higher-probability instruments improves efficiency and capital utilization.

In addition to performance averages, distribution analysis can be informative. A small number of large gains may drive overall profitability, while frequent small losses accumulate gradually. Understanding how returns are distributed helps refine expectations and manage drawdowns realistically.

Evaluating Risk Management Discipline

Risk management is central to sustainable trading. The weekly review should include verification that stop-loss levels were respected and not widened without justification. Any deviations from risk parameters require documentation and explanation.

Compare planned risk per trade with actual realized risk. If slippage or volatility caused larger-than-expected losses, adjustments in order type or timing may be necessary. Examine whether position correlation increased portfolio exposure beyond intended limits. Even when individual trades adhere to risk thresholds, correlated positions can amplify cumulative risk.

Evaluate whether profit targets were adjusted impulsively or according to objective developments. Consistency in applying risk management rules strengthens long-term stability and reduces vulnerability to behavioral fluctuations.

Identifying Patterns and Trends

Once trades, statistics, and emotional notes have been reviewed, the next phase involves synthesizing insights to identify patterns. Patterns may relate to technical setups, market timing, behavioral responses, or environmental factors.

Win/Loss Patterns: Determine whether certain trading sessions, such as specific days of the week or times of day, correlate with higher profitability. For example, some traders observe greater volatility at market open, while others achieve consistent results during mid-session consolidation. Recognizing these tendencies allows for selective focus.

Routines and Biases: Consistent routines often enhance discipline. Assess whether deviations from established routines correspond with underperformance. Traders may also uncover cognitive biases, such as confirmation bias or recency bias. Documenting repeated instances of these tendencies enables structured mitigation.

Market Conditions: Analyze performance in relation to volatility, liquidity, and trend strength. If trades during high-volatility weeks outperform those in stable environments, strategy adjustments may be necessary to reduce activity during low-momentum periods. Understanding environmental influence promotes adaptive positioning rather than fixed behavior.

Patterns may also emerge in trade management decisions. For instance, prematurely closing profitable trades due to fear may limit average gains. Alternatively, holding losing positions longer than planned can expand losses. Weekly synthesis transforms isolated observations into broader strategic awareness.

Refining Trading Processes

Based on identified patterns, the review should extend into process refinement. This involves translating observations into practical modifications. If analysis shows that trades initiated outside predefined setups underperform, tighten entry criteria. If overtrading occurs during periods of low-quality signals, establish maximum daily trade limits.

Process refinement may also involve improving pre-trade preparation. Traders can enhance market scanning procedures, adjust watchlists, or incorporate additional confirmation indicators. Weekly review findings should result in tangible procedural amendments rather than abstract intentions.

Record each adjustment clearly in the journal. During subsequent reviews, evaluate whether implemented changes improved outcomes. This cyclical process of analysis, modification, and reassessment forms a continuous improvement loop.

Setting Goals for Improvement

After completing analysis and pattern identification, establish clearly defined objectives for the upcoming period. Goals should adhere to measurable criteria to ensure accountability.

For example, a trader seeking to improve risk discipline might specify that no trade will exceed a defined percentage of account equity. Another goal may involve reducing impulsive trades by requiring written confirmation of setup criteria before execution. Time-bound evaluation, such as reassessment after four weeks, ensures progress tracking.

Performance-based goals should remain realistic and process-oriented. Rather than targeting specific profit amounts, focus on execution metrics within direct control. Objective goals shift emphasis from outcome dependency to behavioral consistency.

Document goals alongside corresponding action steps. During the next weekly review, assess compliance with these objectives before establishing new ones. Incremental adjustments create measurable improvement without introducing abrupt strategic shifts.

Integrating Technology in Journal Reviews

Modern trading platforms and analytical tools can enhance journal effectiveness. Automated trade exports ensure data accuracy, while spreadsheet or software analysis facilitates statistical evaluation. Visualization tools, such as equity curves and distribution charts, allow traders to interpret performance trends efficiently.

However, automation should complement rather than replace reflective assessment. Emotional documentation and contextual notes remain essential elements that software cannot fully interpret. Combining quantitative precision with qualitative evaluation produces comprehensive insight.

Digital journals also permit tagging systems. Trades can be categorized by setup type, market condition, or psychological state. During weekly review, filtering by tags streamlines comparative analysis. Over time, these categorizations contribute to a robust performance database.

Establishing Consistency in Weekly Reviews

The effectiveness of weekly reviews depends on consistency. Select a fixed time each week dedicated exclusively to analysis. Conduct the review outside active trading hours to minimize distraction. A calm environment supports objective thinking and reduces reactionary judgment.

Approach each review with neutrality. The purpose is evaluation, not self-criticism or justification. Viewing negative outcomes as data points rather than failures preserves objectivity. Similarly, profitable outcomes should be examined critically to confirm that they resulted from disciplined execution.

Maintain archival records of weekly reviews. Comparing summaries over multiple months reveals long-term evolution. Sustained improvement often appears gradually; consistent documentation allows progress to become measurable.

Conclusion

A comprehensive weekly trading journal review transforms routine recordkeeping into a structured performance management system. Through chronological trade examination, rigorous statistical analysis, emotional evaluation, and pattern identification, traders gain objective insight into their behavior and strategy effectiveness.

By refining processes, reinforcing risk discipline, and establishing measurable goals, traders shift from reactive participation to systematic development. Consistency in review practices strengthens adaptability in changing market conditions and supports stable decision-making.

Over time, disciplined journal analysis provides a foundation for sustained growth. Weekly reflection ensures that experience converts into structured knowledge, enabling traders to improve methodically within the dynamic context of financial markets.

Daily Trading Journal Prompts That Improve Discipline

Introduction to Daily Trading Journal Prompts

Maintaining a disciplined approach to trading is essential for any serious market participant. Financial markets are dynamic, influenced by economic data, geopolitical developments, institutional flows, and shifting sentiment. In such an environment, consistency is difficult to achieve without structured reflection and performance tracking. A daily trading journal provides that structure. It transforms trading from a series of isolated decisions into a documented process that can be evaluated, refined, and improved over time.

A well-maintained journal serves multiple purposes. It records transactional data, captures strategic intent, documents psychological influences, and preserves contextual market analysis. By reviewing this information regularly, traders can identify recurring behaviors, strengths, weaknesses, and patterns that may not be visible in real time. The following sections expand upon practical prompts that encourage analytical thinking, disciplined execution, and long-term development.

Record the Basics

Each journal entry should begin with foundational information. Recording the date, time, and instrument traded is the minimum requirement for meaningful documentation. These elements form the structural framework of a trading record. Without this basic data, it becomes difficult to place the trade in context or analyze it relative to broader market activity.

Beyond these essentials, traders may also note the trading session, such as whether the position was opened during the Asian, European, or North American session, or during pre-market or after-hours trading. Volatility and liquidity often vary significantly across sessions, influencing both risk exposure and execution quality. Documenting these details allows for comparison across different environments.

Additional fundamental information might include position size, account balance at the time of entry, and risk allocation as a percentage of portfolio value. This creates a measurable record of risk management practices and enables later analysis of how exposure levels affected overall performance.

Set Clear Objectives

Before entering a trade, a disciplined trader defines explicit objectives. The journal should record the planned entry price, intended profit target, and predetermined stop-loss level. These parameters clarify the trade’s risk-to-reward ratio and provide a benchmark against which adherence can be evaluated.

Documenting objectives serves two important purposes. First, it forces the trader to articulate the rationale behind the position rather than acting impulsively. Second, it creates accountability. If the trade deviates from the initial plan, the journal provides evidence of whether that deviation was justified by new information or influenced by inconsistency.

Clear objectives should also include the strategic category of the trade. For example, was it a breakout strategy, a reversal setup, a trend continuation position, or a mean-reversion trade? Identifying the setup helps classify data over time and supports statistical analysis of which strategy types produce the most consistent results.

Analyze Market Conditions

Every trade exists within a broader market context. Recording market conditions prior to entry is critical for understanding why a setup appeared favorable at that moment. Traders should describe whether the broader market was trending, ranging, or experiencing increased volatility.

Macroeconomic elements may also influence trade decisions. Notes on recent economic indicators, central bank announcements, earnings releases, or geopolitical developments provide context. Even if the strategy is technically focused, macroeconomic conditions can affect liquidity and volatility levels, altering the behavior of price movements.

Technical analysis observations should be clearly described. This may include key support and resistance levels, moving average alignment, chart patterns, volume characteristics, or volatility measures. Rather than simply noting that a pattern existed, the trader should describe why it qualified under the predefined trading plan.

Over time, these contextual notes enable pattern recognition. A trader may identify that specific strategies perform better under trending conditions, while others succeed primarily in consolidating markets. Such insights are only possible when contextual information is consistently recorded.

Clarify the Trading Thesis

Beyond general market conditions, each trade should be accompanied by a clear trading thesis. This is a concise explanation of why the trade is expected to work. The thesis should describe the underlying logic, not just the observable setup. For instance, the rationale might be that institutional accumulation is evident through rising volume at higher lows, or that a breakout above resistance may trigger stop orders and momentum buying.

Writing the thesis forces analytical rigor. If the reasoning cannot be expressed clearly in writing, it may indicate insufficient preparation. Documenting the thesis also provides a reference point when reviewing outcomes. If the trade fails, the trader can assess whether the thesis was invalid from the start or undermined by new information after entry.

Define Risk Management Parameters

Risk management is central to professional trading. The journal should specify the maximum risk per trade, expressed either as a percentage of total capital or as a fixed monetary amount. Recording this information ensures consistent exposure control and reduces the likelihood of disproportionate losses.

It is also useful to record position sizing methodology. For example, was the size determined by volatility-adjusted calculations, fixed fractional rules, or a discretionary assessment? Over time, reviewing this information helps determine whether sizing decisions align with long-term performance objectives.

Adjustments to stop-loss levels or scaling in and out of positions should be documented with precise explanations. This transparency clarifies whether changes were part of a predefined plan or reactive responses to price movement.

Reflect on Your Emotional State

Psychological factors play a measurable role in trading outcomes. Journaling provides an opportunity to document your emotional state before, during, and after each trade. Examples may include feeling focused, distracted, fatigued, or under external time pressure. Rather than relying on vague impressions, the goal is to identify conditions that correlate with performance variations.

Describing emotions in neutral, factual language enhances objectivity. For example, instead of stating that the market felt overwhelming, one might note that volatility increased rapidly and attention shifted between multiple open positions. Precision in language reduces ambiguity.

Over an extended period, emotional reflections may reveal patterns. A trader might observe that trades initiated after consecutive losses show altered risk tolerance, or that decision-making quality declines during periods of insufficient preparation. Recognizing these correlations enables proactive adjustments, such as scheduling breaks or refining pre-trade routines.

Evaluate Trade Execution

Execution quality can significantly affect outcomes, particularly in fast-moving markets. After closing a trade, the journal should include a detailed review of entry and exit points. Compare actual execution prices to planned levels and analyze any discrepancies.

Consider whether the chosen order type was appropriate. Market orders provide certainty of execution but may introduce slippage during volatility. Limit orders offer price control but risk non-execution. Documenting the rationale behind order selection supports continuous improvement in execution strategy.

Technical factors such as latency, platform functionality, and connectivity should also be considered when relevant. If an execution delay contributed to adverse results, it is important to distinguish operational issues from strategic flaws.

Assess Your Results

After the trade concludes, a comprehensive outcome assessment should be recorded. Profit or loss figures are an objective measure, but they represent only one aspect of performance. A trade that produces a profit despite deviating from the plan may reinforce undisciplined behavior, while a losing trade executed according to predefined rules may demonstrate strategic consistency.

In the journal, note whether the trade followed the original objectives regarding entry, stop-loss adherence, and target placement. If deviations occurred, describe the reasoning and evaluate whether adjustments were justified by new evidence or by reactive impulses.

Statistical tracking is also valuable. Recording metrics such as win rate, average gain, average loss, and risk-to-reward ratios across multiple trades provides quantitative insight into system effectiveness. These statistics become meaningful over a sufficient sample size.

Document Lessons and Observations

Each trade offers information that can inform future decisions. After evaluating results, summarize key observations under a dedicated section for lessons learned. These observations should be specific and actionable. For instance, note whether a particular indicator lagged in volatile conditions, or whether reduced position size improved decision clarity.

Equally important is documenting what worked effectively. Reinforcing positive habits strengthens consistency. When a strategy aligns precisely with the trading plan and produces the expected result, record the conditions and confirm that the process was followed without deviation.

The purpose of this documentation is not to judge isolated outcomes but to refine a structured approach through repeated observation.

Weekly and Monthly Reviews

While daily entries are detailed and granular, periodic reviews provide broader perspective. At the end of each week or month, revisit journal entries to identify recurring patterns. Analyze performance by strategy type, time of day, and asset class.

During these reviews, evaluate aggregate statistics and compare them with predefined goals. If discrepancies persist, adjustments to the trading plan may be warranted. These adjustments should be deliberate and documented, not reactive responses to short-term performance fluctuations.

Structured reviews transform the journal into a strategic development tool rather than a passive record.

Developing Consistency in Journaling

The effectiveness of a trading journal depends on consistency. Incomplete or irregular entries limit analytical value. Establishing a routine—such as completing entries immediately after each trade—ensures accuracy and reduces reliance on memory.

Digital platforms, spreadsheets, or specialized software can streamline data entry and enable automated statistical analysis. However, the format is secondary to the quality of reflection. Clear writing, precise observations, and disciplined documentation are more important than complex design.

Over time, journaling becomes an integrated component of the trading process rather than an administrative task.

Integrating Performance Metrics with Narrative Analysis

Quantitative data and qualitative reflection should complement each other. Numerical metrics provide objectivity, while narrative explanations supply context. For instance, a series of small losses may appear problematic statistically, but narrative notes might reveal that those trades were part of a breakout strategy during low-volatility consolidation, a condition unsuitable for such setups.

Combining statistical evaluation with written analysis produces a balanced perspective. It prevents overreliance on isolated numbers and supports informed strategic refinement.

Continual Improvement

The trading environment is continuously evolving. Strategies that perform effectively in one market phase may weaken in another. A trading journal supports continual improvement by preserving a historical record of how strategies performed under varying conditions.

Regularly revisiting past entries helps detect gradual shifts in effectiveness. If a pattern begins to underperform, the journal may reveal that volatility regimes have changed or that execution timing has drifted from original criteria. Such insights facilitate timely adaptation.

Continual improvement also involves refining personal discipline. Consistent journaling strengthens accountability and promotes structured thinking. Over time, traders may find that simply knowing trades will be reviewed encourages adherence to established plans.

Building a Professional Mindset

A comprehensive trading journal reflects a professional approach to market participation. Documenting analysis, decisions, risk management, and outcomes creates a transparent record of development. This transparency supports objective evaluation and fosters long-term skill enhancement.

The discipline of writing promotes clarity. It encourages traders to define hypotheses, measure results, and adjust strategies based on evidence. Through steady documentation and review, the journal becomes both a learning archive and a decision-support system.

In practical terms, daily trading journal prompts guide attention to essential components of performance: preparation, execution, context, psychology, and review. When each of these elements is recorded systematically, trading evolves from isolated actions into a structured and analyzable practice. Consistency in this process contributes to measured growth, improved discipline, and sustained strategic development in competitive financial markets.

What to Record After Every Trade in a Trading Journal

Understanding the Importance of a Trading Journal

A trading journal is a structured record of trading activity designed to support consistent improvement and informed decision-making. For traders operating in financial markets, whether in equities, derivatives, foreign exchange, or digital assets, performance depends not only on market knowledge but also on disciplined execution and ongoing evaluation. A trading journal provides the framework for that evaluation. It transforms trading from a sequence of isolated decisions into a measurable and reviewable process.

At its core, a trading journal functions as both a data repository and a performance analysis tool. It captures quantitative metrics such as entry prices and returns, while also preserving qualitative elements such as reasoning and market context. Over time, this accumulation of information enables traders to identify patterns in their behavior and strategies. Rather than relying on memory or subjective impressions, they can review precise records. This systematic approach reduces reliance on assumptions and encourages decisions grounded in evidence.

Maintaining a journal also introduces accountability. Each trade must be justified, described, and evaluated. This requirement supports adherence to predefined trading plans and discourages impulsive actions. When traders know that every decision will be documented and later reviewed, they are more likely to follow established criteria. As a result, the trading journal supports discipline, consistency, and continuous refinement of methodology.

Recording Trade Details

The foundation of an effective trading journal lies in accurately documenting the essential details of every transaction. Immediately after executing a trade, the trader should record the date and time to establish a chronological framework. The timing of a trade can reveal valuable insights when analyzed later, such as whether performance varies during certain sessions or around specific market openings and closings.

Equally important is identifying the instrument traded. This may include a stock ticker, a futures contract, a currency pair, or another asset classification. By organizing records by instrument, traders can evaluate performance across sectors or asset classes. They may discover, for example, that certain instruments align better with their strategies or risk tolerance.

The journal should clearly specify whether the position was long or short. Directional bias plays a significant role in outcomes, especially during markets characterized by sustained trends or prolonged consolidation. Tracking position type allows traders to evaluate whether their strategies perform consistently in both rising and falling markets.

The quantity of shares, lots, or contracts executed must also be documented. Position size directly affects potential profit and risk exposure. By reviewing historical position sizes alongside outcomes, traders can assess whether scaling decisions were appropriate. Patterns may emerge indicating overexposure during losing periods or insufficient sizing during profitable trends.

This detailed recording of trade attributes establishes a reliable data set. Without this foundational information, subsequent analysis becomes incomplete or potentially inaccurate. Accurate documentation ensures that performance conclusions are built on verifiable facts rather than recollection.

Entry and Exit Points

Precise recording of entry price and exit price is central to evaluating trade effectiveness. The difference between these values determines the gross result of a trade, but the implications extend further. By studying entry points, traders can determine whether their timing aligned with their strategy rules. Consistent late entries, for example, may indicate hesitation or delayed confirmation.

Exit prices provide insight into discipline and strategy execution. Traders often develop predefined rules for exiting positions, but actual behavior may differ under live conditions. Documenting exits helps detect deviations from planned thresholds. If exits consistently occur before reaching projected targets, it may reflect premature decision-making. Conversely, exits that exceed stop-loss levels may indicate a failure to adhere to risk management guidelines.

Recording stop-loss and take-profit levels at the time of trade entry adds further clarity. These predefined parameters define the intended risk-reward structure. Comparing planned exit levels with actual outcomes highlights whether the original risk framework was respected. Over time, this data can reveal whether certain stop distances are consistently too tight or excessively broad relative to market volatility.

Analyzing entry and exit trends also supports refinement of technical or fundamental signals. If trades triggered by a specific indicator show lower average returns, adjustments may be warranted. The journal thus becomes a feedback mechanism through which strategy quality can be evaluated and improved.

Analyzing Market Conditions

Market context plays a decisive role in trade outcomes. Documenting prevailing market conditions at the time of execution adds interpretive depth to the numerical results. A trade that performs poorly in a range-bound environment may still be valid if the strategy is designed primarily for trending conditions. Without contextual documentation, such distinctions are difficult to assess.

Describing whether the market was bullish, bearish, or neutral allows traders to categorize results by overall direction. Performance analysis segmented by market phase can reveal strengths and weaknesses. A trend-following system may exhibit strong returns during sustained directional movement but underperform during consolidation. Recognizing this pattern allows the trader to adapt expectations or modify strategy deployment.

In addition to directional bias, traders should record significant economic news, corporate announcements, or geopolitical events occurring near the time of the trade. Macroeconomic releases, earnings reports, and central bank statements can influence price volatility and liquidity. By noting these factors, traders gain perspective on whether outcomes were driven primarily by strategy execution or by external catalysts.

This contextual layer transforms isolated trade data into a comprehensive analytical record. Patterns often emerge only when market environment is considered. A strategy that appears inconsistent in aggregate may demonstrate strong performance within specific conditions. Thorough documentation enables such nuanced evaluation.

Trade Rationale and Strategy

Beyond numerical data, every journal entry should include a concise explanation of the rationale behind the trade. This section captures the trader’s reasoning at the moment of decision. It may reference technical indicators, chart patterns, fundamental analysis, quantitative signals, or a combination of factors. Recording this information ensures that decisions align with the larger strategies defined in the trading plan.

By documenting rationale, traders create a reference point for later comparison. If outcomes repeatedly diverge from expectations, reviewing the original reasoning can highlight flaws in assessment. It may reveal that certain setups were misinterpreted or that confirmation criteria were inconsistently applied.

This process also promotes consistency. When traders articulate their reasoning in writing, they are more likely to adhere to structured criteria rather than act on impulse. The act of documentation reinforces alignment with planned methodologies. Over time, this contributes to systematic refinement rather than random experimentation.

Furthermore, analyzing rationale entries across many trades can reveal cognitive biases. If certain justifications recur during losing trades, they may signal overconfidence in specific patterns or indicators. Recognizing such tendencies supports objective recalibration of strategy parameters.

Outcome and Performance Metrics

After closing a position, the journal should record the final profit or loss. This figure should account for transaction costs, commissions, and slippage to ensure an accurate representation of net performance. Gross figures alone may overstate effectiveness.

In addition to raw results, traders should calculate the return on investment (ROI) relative to capital committed. ROI allows comparisons across trades of varying sizes. A smaller trade yielding a higher percentage return may demonstrate greater efficiency than a larger position with a modest gain.

The risk-reward ratio is another critical metric. By comparing the potential loss defined by the stop-loss with the intended gain defined by the target, traders assess whether the projected reward justifies the risk taken. Over time, aggregate analysis of risk-reward metrics can indicate whether the overall expectancy of the trading system is positive.

Advanced performance evaluation may include metrics such as win rate, average gain versus average loss, maximum drawdown, and expectancy per trade. These calculations provide an objective measure of system viability. Rather than relying on isolated profitable trades, traders assess performance across a statistically meaningful sample.

The journal thus becomes a repository of measurable outcomes. Quantitative evaluation reduces reliance on perception and fosters data-driven improvement.

Emotional Reflection

Although financial markets operate on quantitative principles, trading decisions are influenced by psychological factors. Including commentary on one’s emotional state before, during, and after a trade contributes to comprehensive analysis. This reflection should be factual rather than expressive, focusing on observable states such as hesitation, overconfidence, distraction, or urgency.

Recording emotional context allows traders to correlate psychological conditions with performance outcomes. For instance, a series of trades entered during periods of fatigue may show inconsistent adherence to rules. Awareness of such patterns supports proactive adjustment of trading schedules or routines.

This dimension of documentation does not replace quantitative evaluation but complements it. By recognizing the interaction between emotional state and execution quality, traders can implement safeguards such as predefined daily limits or structured review sessions. Consistent monitoring of psychological factors contributes to long-term stability in trading behavior.

Lessons Learned

Each journal entry should conclude with an assessment of lessons learned. This section synthesizes quantitative results, contextual factors, and self-evaluation into actionable insights. Lessons may relate to strategy refinement, risk management, timing adjustments, or behavioral discipline.

The purpose of this concluding reflection is not to criticize outcomes but to extract constructive information. Positive trades may reveal effective practices that should be reinforced, while negative trades may identify areas for systematic improvement. Consistent review of lessons across multiple entries allows traders to recognize recurring weaknesses and strengths.

Over time, the accumulation of documented insights forms a knowledge base unique to the individual trader. This personal archive can guide future rule adjustments and training priorities. By converting experience into recorded learning, the trading journal supports structured professional development.

Utilizing the Trading Journal

The value of a trading journal depends on regular and methodical review. Periodic analysis should be conducted to identify patterns in performance metrics, strategy effectiveness, and behavioral tendencies. Monthly or quarterly reviews can reveal trends that are not apparent from examining individual trades in isolation.

During review sessions, traders may categorize trades by setup type, market condition, or time frame. Statistical summaries help determine which categories generate consistent returns. Strategies that underperform can be adjusted or discontinued, while strong-performing approaches may warrant increased allocation of capital.

Integration of journal findings with ongoing education enhances their usefulness. As traders study new methodologies or refine existing systems, they can compare theoretical concepts against historical journal data. This comparison ensures that modifications are grounded in empirical evidence rather than assumption.

The journal should also inform risk management practices. If analysis indicates that certain drawdowns follow specific patterns, traders can implement preventative measures such as reducing exposure during similar conditions. Continuous feedback between record-keeping and execution creates an adaptive framework.

Maintaining Consistency and Structure

For a trading journal to remain effective, it must be maintained consistently. Irregular entries undermine the integrity of performance analysis. Standardized formats, whether digital spreadsheets or specialized software, ensure that essential data fields are captured for every trade.

Clarity and organization facilitate efficient review. Columns for numerical data should be clearly defined, while narrative sections should remain concise and relevant. Overly fragmented or inconsistent formatting complicates analysis and reduces the journal’s practical value.

Adopting a structured approach also simplifies long-term comparison. As trading strategies evolve, standardized data enables cross-period evaluation. This continuity supports objective assessment of whether modifications produce measurable improvement.

Long-Term Benefits of Systematic Documentation

Over extended periods, the cumulative effect of disciplined journaling becomes significant. Traders develop a detailed historical record that reflects strategic evolution, performance fluctuations, and behavioral adjustments. This longitudinal perspective encourages strategic thinking and reduces short-term reaction to isolated outcomes.

A well-maintained journal also enhances transparency and credibility. For professional traders, it can serve as documentation of methodology and performance consistency. For independent traders, it provides internal verification of progress and helps establish realistic expectations.

Systematic documentation ultimately supports the transition from discretionary, reactive trading toward structured, rule-based execution. By combining precise numerical tracking with contextual and behavioral reflection, the trading journal functions as both a measurement instrument and a development tool. Its consistent use fosters disciplined decision-making, evidence-based strategy refinement, and sustained improvement in trading performance.

How to Structure a Trading Journal for Better Decision Review

Introduction

A trading journal is a systematic record of trading activity designed to improve analysis, execution, and long-term performance. In financial markets where outcomes are influenced by variability, incomplete information, and changing conditions, traders rely on structured processes to reduce inconsistency. A journal functions as both a historical archive and an analytical framework. By documenting trades in a disciplined manner, traders create a reliable source of data that can be examined objectively.

The value of a trading journal extends beyond simple recordkeeping. It provides a mechanism for evaluating decision quality, measuring adherence to strategic rules, and monitoring behavioral tendencies. Without written documentation, traders often rely on memory, which is subject to distortion and selective recall. A journal replaces subjective recollection with verifiable information. Over time, this documentation supports incremental improvements that can substantially influence performance.

Purpose of a Trading Journal

The primary purpose of a trading journal is to create accountability and structure within the trading process. Each recorded entry requires the trader to clarify intent, define risk parameters, and articulate the reasoning behind the trade. This reduces impulsive behavior and increases transparency in decision-making.

A journal also enables systematic learning. Financial markets generate continuous feedback through winning and losing trades. However, without structured review, that feedback remains unorganized and difficult to interpret. Recording each trade makes it possible to compare expected outcomes with actual results. Traders can evaluate whether profits were achieved through disciplined execution or favorable randomness. Similarly, losses can be assessed to determine whether they resulted from strategic flaws or acceptable risk exposure.

Another important function is performance tracking. Traders often focus on short-term outcomes, which can obscure long-term trends. A journal provides cumulative data that reveals patterns across months or years. These patterns may include consistent profitability in specific market conditions, weaknesses during particular times of day, or overexposure to correlated assets. Identifying such tendencies is essential for improving strategic alignment.

In addition, a trading journal facilitates strategic refinement. As markets evolve, strategies that were once effective may require adjustment. By maintaining a structured database of past trades, traders can test modifications against historical records. This evidence-based approach reduces reliance on speculation when adapting strategies.

Components of a Trading Journal

Although individual preferences vary, certain components form the foundation of an effective trading journal. Consistency in recording these elements is more important than complexity.

Trade Details: Each entry should specify the date, time, trading instrument, platform used, and market conditions at execution. Information regarding position size, entry price, exit price, and stop-loss or take-profit levels must be documented accurately. Including the risk amount in monetary and percentage terms enables effective comparison across trades. For traders operating in multiple markets, noting asset class or sector exposure can provide additional clarity.

Reason for Trade: Every trade should be accompanied by a clearly defined rationale. This may involve technical indicators, price patterns, volatility conditions, macroeconomic data, earnings announcements, or quantitative signals. The explanation should describe the setup criteria and confirm that predefined conditions were satisfied. By articulating reasoning before or immediately after entry, traders limit retrospective justification and maintain objectivity.

Outcome of the Trade: Outcomes should include absolute profit or loss, percentage return relative to account size, and risk-adjusted measures when applicable. It is useful to record whether the exit followed the predefined plan or was influenced by discretionary judgment. Capturing slippage, commissions, and spread costs ensures realistic assessment of net performance. If scaling in or out of positions occurred, this process should be described to preserve contextual accuracy.

Trade Reflection: Reflection distinguishes a journal from a simple transaction log. After a trade closes, traders should evaluate execution quality, timing, discipline, and rule adherence. Emotional responses such as hesitation, overconfidence, or anxiety may be noted objectively without exaggeration. Identifying procedural errors, missed signals, or improvements in execution contributes to skill development. Over time, reflective entries reveal behavioral patterns that influence outcomes.

Structuring Entries for Maximum Utility

Organization determines whether a trading journal functions effectively. Entries should follow a consistent template that simplifies comparison. Using standardized fields guarantees that critical information is not omitted. Many traders design templates divided into pre-trade, in-trade, and post-trade sections. This chronological structure preserves decision clarity and distinguishes analysis performed before execution from interpretation formed afterward.

Clarity in language also matters. Statements such as “entered because price looked strong” lack analytical value. A more structured description would specify measurable conditions, such as “entered after breakout above resistance level with volume exceeding 20-day average.” Precision supports future evaluation because objective criteria can be tested and replicated.

Maintaining chronological continuity is equally important. Journals should record trades sequentially, even during losing streaks. Omitting trades disrupts data integrity and reduces analytical reliability. Consistent documentation fosters discipline and ensures that review sessions represent the full performance record.

Benefits of Structured Reviewing

Regular review sessions convert raw data into actionable insight. Without periodic analysis, journals accumulate information without delivering improvement. A structured review process may occur weekly, monthly, or quarterly, depending on trading frequency.

Pattern Recognition: Through systematic evaluation, traders can identify recurring scenarios associated with favorable outcomes. For example, specific chart formations, volatility expansions, or macroeconomic conditions may correspond with higher success rates. Conversely, particular signals may underperform in low-liquidity environments. Recognizing these associations allows strategic adjustment grounded in empirical observation.

Behavioral patterns also emerge through review. Traders may discover tendencies to exit profitable trades prematurely or widen stop-loss levels during volatile periods. Identifying these tendencies creates opportunities for corrective rule implementation. Because behavioral consistency significantly influences performance, awareness of such patterns contributes to stability.

Improved Discipline: The obligation to document each trade encourages rule-based conduct. Traders aware that every deviation will be recorded are more likely to adhere to predefined criteria. This accountability reduces impulsive decision-making and reinforces execution standards. Over extended periods, disciplined behavior becomes habitual, supporting consistent performance.

Performance Metrics: Quantitative analysis transforms journal entries into measurable indicators. Calculating win rate, average gain, average loss, expectancy, maximum drawdown, and risk-reward ratio provides a structured evaluation of strategy viability. These metrics allow traders to determine whether profitability arises from high accuracy, favorable reward-to-risk ratios, or a combination of both.

Beyond basic metrics, examining trade duration, exposure by asset class, and correlation between trades enhances strategic alignment. For example, if several losing trades occur simultaneously across correlated positions, portfolio diversification rules may require modification. Statistical evaluation introduces analytical rigor and reduces reliance on anecdotal reasoning.

Psychological and Behavioral Insights

Financial decision-making involves cognitive biases that can influence execution. A trading journal helps identify and mitigate these biases. By recording thoughts before entering trades, traders can detect patterns such as confirmation bias, where only supportive evidence is considered. Documentation also reveals instances of loss aversion, where traders hesitate to close losing positions due to reluctance to realize losses.

Overconfidence may manifest through excessive position sizing following a series of profitable trades. Fear may result in inconsistent strategy application after periods of volatility. When these tendencies are systematically recorded, they become observable and manageable. Structured reflection provides a foundation for implementing behavioral safeguards such as predefined risk limits or cooling-off periods.

Maintaining objectivity during reflection is essential. Emotional language can obscure analytical clarity. Instead of describing a trade as “frustrating” or “exciting,” traders should focus on identifiable factors such as rule deviations or timing errors. This neutral approach supports rational evaluation.

Risk Management Integration

A complete trading journal integrates risk management records directly into each entry. Risk per trade, percentage of total capital exposed, and aggregate exposure at any given time should be documented. Tracking these values ensures that trades remain aligned with account preservation principles.

Reviewing risk data can reveal inconsistencies. For example, if larger position sizes coincide with reduced win rates, position sizing rules may require adjustment. Similarly, persistent drawdowns following correlated exposures indicate a need for diversification controls. Integrating risk information into journal analysis strengthens long-term sustainability.

Monitoring maximum consecutive losses and overall drawdown duration also informs capital allocation decisions. By analyzing these trends, traders develop realistic expectations regarding volatility in returns. This reduces the likelihood of abrupt strategy abandonment during temporary downturns.

Choosing the Right Format for Your Journal

The effectiveness of a trading journal depends partly on its accessibility and usability. Traders should choose a format that encourages consistent updating and facilitates analysis.

Physical Journals: Handwritten journals offer a tactile method of recording observations. Writing by hand requires deliberate engagement, which can enhance reflection quality. Physical journals may be suitable for discretionary traders who prioritize narrative analysis. However, calculating performance metrics manually can become time-intensive as trade volume increases.

Spreadsheets: Digital spreadsheets provide flexibility and computational capability. Traders can design customized templates incorporating automatic calculations of performance metrics. Filters and sorting functions allow targeted analysis by instrument, timeframe, or strategy type. Spreadsheets are particularly useful for active traders managing large datasets.

Specialized Software: Dedicated trading journal applications often integrate directly with brokerage platforms, importing trade data automatically. These systems may include graphical performance dashboards, risk analytics, and tagging functions for categorizing trades. Automation reduces manual entry errors and saves time. When selecting software, traders should evaluate compatibility with their trading platform and ensure data security standards meet regulatory requirements.

Regardless of format, consistent usage is more important than technological sophistication. A simple but regularly updated journal is more effective than an advanced system used inconsistently.

Implementation and Consistency

Establishing a journal requires initial setup and procedural commitment. Traders should define the variables most relevant to their strategy and create a standardized template. Allocating a specific time for updates, such as immediately after trade execution or at the end of each trading session, ensures continuity.

Regular review sessions should be scheduled independently of daily trading activity. Separating execution from evaluation reduces bias and promotes objective analysis. During these sessions, traders examine aggregated data, compare performance against strategic goals, and document conclusions for future reference.

Consistency reinforces habit formation. As journaling becomes integrated into routine operations, it transitions from a corrective mechanism to a preventative tool. Traders begin anticipating journal review while executing trades, encouraging disciplined conduct in real time.

Conclusion

A structured trading journal supports systematic improvement by combining detailed documentation with analytical review. Recording trade details, rationales, outcomes, and reflections transforms individual transactions into a coherent dataset. Structured reviewing enables recognition of strategic strengths and weaknesses, while quantitative metrics provide objective performance measurement.

Through disciplined journaling, traders gain insight into behavioral tendencies, refine risk management practices, and enhance strategic alignment. The choice of format—whether physical, spreadsheet-based, or software-driven—should prioritize usability and consistency. When maintained regularly and reviewed methodically, a trading journal becomes an essential instrument for long-term development and informed decision-making in financial markets.

The One Trading Book That Changed My Entire Approach

Introduction

The realm of trading is a complex and often daunting environment. Many traders spend years developing strategies, only to find them consistently underperforming. Among the myriad of resources available to traders, certain books can sometimes substantially alter one’s approach to trading. This article delves into one such book that had a profound impact on my trading methodology, sparking a complete overhaul in my approach.

The Book That Made the Difference

In my journey to refine trading strategies, I encountered various books promising insights and techniques. However, it was not until I read “Trading in the Zone” by Mark Douglas that my perspective began to shift. Unlike many trading books that focus predominantly on technical analysis or chart patterns, Douglas’s work highlights the importance of trading psychology. This book illuminated aspects of trading that I had previously overlooked, particularly the critical role of mental discipline and attitude.

Key Insights from the Book

Douglas’s book provided several pivotal insights that have structured the way I perceive each trading activity.

Understanding Probabilities: One significant takeaway was the concept that trading results are governed by probabilities. This realization emphasized the importance of managing risks and accepting losses as an inherent aspect of trading. It shifted my viewpoint from a deterministic outlook to one that understands the nature of markets as inherently uncertain.

Emotional Discipline: The book stresses the necessity of maintaining emotional control when making trading decisions. This includes managing fear and greed, which often cloud judgment during transactions. Recognizing emotional impulses and learning ways to deal with them effectively became fundamental aspects of my trading routine.

The Illusion of Control: Douglas argues that many traders operate under an illusion of control, believing they can predict market movements. Understanding that markets are unpredictable allowed me to focus more on strategy and risk management rather than prediction. By accepting that I cannot control market outcomes but can manage my reactions to them, I found greater stability in my trading endeavors.

Implementing the Teachings

After digesting the insights from “Trading in the Zone”, I began integrating its lessons into my trading practice. This involved reshaping my trading plan to incorporate the management of emotions and acceptance of probabilistic outcomes. The transformation in my approach included several key strategies:

Risk Management Strategies: Implementing strict risk management protocols became a priority. This included setting stop-loss orders to protect against significant losses and ensuring that each trade carried an acceptable risk-reward ratio. My approach to risk assessment matured, with a clear focus on preserving capital.

Developing a Trading Routine: Establishing a disciplined trading routine helped maintain consistency. This routine was not just about placing trades but also involved regular reviews of performances and adaption to new market conditions. Consistency in preparation, execution, and review processes became the backbone of my trading activities.

Continuous Learning and Adaptation: Recognizing that trading is a journey, not a destination, has encouraged a mindset of continuous learning and adaptation. Market conditions are constantly evolving, meaning strategies must remain flexible and responsive. Continuous education through reading, seminars, and practice becomes a non-negotiable aspect of preparedness in trading.

Resources for Further Exploration

For those interested in exploring the psychological aspects of trading further, several resources offer valuable insights. Websites such as Trader Psychology provide articles and resources focused on the mental aspects of trading, offering a deeper dive into techniques that enhance mental fortitude in trading scenarios.

Additionally, Investopedia offers a wide range of articles and tutorials not only on the technical aspects of trading but also on trading psychology. It serves as an extensive resource for both beginners and experienced traders looking to expand their knowledge base.

Finally, platforms like Amazon host a plethora of books dedicated to trading, including works that focus on psychology and strategy refinement. These resources are helpful for those wishing to explore detailed accounts and advice from seasoned trading professionals.

Conclusion

While many trading resources emphasize strategies and techniques, “Trading in the Zone” by Mark Douglas shifted my focus towards understanding the intrinsic psychological elements of trading. This new perspective has not only changed how I approach trading but also enhanced my overall effectiveness in the market. By cultivating a blend of strategy-focused and psychology-driven approaches, I have been able to develop a more holistic view of trading. Embracing the insights from this book has been pivotal in fostering a more rational and disciplined trading practice, ultimately leading to a more rewarding trading journey.

In summary, the insights and practical approaches provided by Mark Douglas have trained attention on the aspects of trading often neglected by those focusing purely on technical indicators. The power of mindset, discipline, and continuous refinement in trading strategies cannot be overstated. By internalizing these lessons, traders can move toward a greater understanding of how internal states affect trading decisions, and consequently, improve their overall trading performance.

How I Used Market Sentiment to Predict a Huge Move

Understanding Market Sentiment

Market sentiment is a crucial factor in the dynamics of financial markets, encapsulating the collective attitude and emotional state of investors towards market conditions. This prevailing sentiment, typically classified as either bullish (optimistic) or bearish (pessimistic), significantly influences trading behaviors and price movements. Understanding shifts in market sentiment can thus provide investors with strategic insights and a potential edge in navigating the complexities of investment decision-making.

The Role of Sentiment Analysis

The core objective of sentiment analysis is to evaluate the emotional tones and opinions expressed by investors and stakeholders. This is achieved by rigorously examining data from diverse sources, which range from traditional media outlets like newspapers and financial journals to modern channels such as social media platforms and varied financial reports. This form of analysis empowers investors to understand and predict market trends by highlighting the crucial role emotions such as fear, greed, and exuberance play in distorting market prices away from intrinsic values.

Sources of Sentiment Data

Gathering and interpreting sentiment data involves delving into several key sources:

News Impact: The influence of news on investor sentiment cannot be overstated. Headlines and in-depth articles alike play a pivotal role in shaping public perception. Through analyzing the tone, whether it be positive, negative, or neutral, and the sheer volume of news coverage, investors can ascertain the sentiment surrounding a particular security or market.

Social Media Trends: With the proliferation of platforms like Twitter, Reddit, and others, real-time sentiment tracking has become feasible. These platforms serve as a vast reservoir of investor sentiment, with individuals expressing their views openly, allowing for the aggregation of public opinion that could suggest future market movements.

Investor Surveys and Reports: Regular surveys and comprehensive reports produced by various financial organizations aim to capture the current mood within the investment ecosystem. These tools provide quantitative metrics that reflect the collective sentiment and are often used to benchmark investor confidence levels.

Using Sentiment to Predict Market Movements

Utilizing sentiment analysis in isolation may yield insights; however, the real potency emerges when combined with other investment analysis techniques. Here are some strategies on how sentiment can be effectively harnessed:

Identifying Extremes: A crucial facet of sentiment analysis is the identification of sentiment extremes. When investor sentiment hits unusually high levels of optimism or pessimism, these can act as contrarian indicators, often preceding a reversal in market trends. For example, overwhelming bullish sentiment might signal an impending downturn, while pervasive bearishness could hint at a potential market bottom.

Divergence Signals: One intriguing aspect of sentiment analysis is the observation of divergences between price movements and sentiment indicators. A classic divergence may involve a scenario where market prices continue to climb while sentiment begins to wane. Such discrepancies often serve as precursors to trend reversals, offering alert investors an opportunity to reposition their strategies accordingly.

Volume Analysis: The confluence of sentiment shifts and trading volume provides another layer of analytical complexity. When a marked change in sentiment is coupled with significant increases in trading volume, it suggests robust investor conviction and could signal significant market moves. This confirmation through volume can bolster the reliability of sentiment-based forecasts.

Case Study: Predicting a Market Upsurge

Consider a scenario where an in-depth analysis of a security revealed imminent upward movement. Several sentiment indicators pointed towards this direction. A surge in positive news coverage across varied and reputable media outlets was paralleled by a noticeable increase in optimistic discussions within social media circles. Together, these indicators reflected growing investor confidence. However, the actual price of the security experienced a temporary plateau, demonstrating a noticeable sentiment-price divergence. This situation presented an archetypical example of how sentiment analysis, when rightly interpreted, could offer foresight into future price performance. Accurately predicting these movements provided a potential advantage to investors who acted upon these insights.

In sum, sentiment analysis constitutes a formidable tool for investors aiming to predict market dynamics more accurately. Investors who grasp the psychological underpinnings and behavioral drivers behind market sentiment are better positioned to anticipate significant market shifts. Those seeking to advance their analytical prowess in investment strategies can access a wealth of resources that delve into sentiment analysis. For a more comprehensive introduction to sentiment analysis methodologies, consider exploring relevant educational materials designed to enhance your analytical capabilities in financial markets.

The Trade That Taught Me About Liquidity Traps

Understanding Liquidity Traps through Personal Experience

In the intricacies of finance and economics, a liquidity trap stands as a particularly challenging phenomenon, often difficult to fully understand without direct experience. The theoretical framework of a liquidity trap was something I was aware of on an intellectual level. However, it wasn’t until a particularly intricate trade scenario that I began to truly comprehend its ramifications. This first-hand experience served as an illuminating real-world example, shedding light on what is often discussed in theoretical economics but less frequently observed with clarity.

What is a Liquidity Trap?

A liquidity trap emerges when a country’s interest rates are exceedingly low, yet the propensity to save remains disproportionately high. This situation effectively renders conventional monetary policy useless. Despite monetary incentives intended to encourage borrowing — such as reduced interest rates — both consumers and businesses choose to hoard cash. This cautionary tendency results in stagnant economic growth. In other words, no matter how favorable borrowing conditions might be, the expected ripple effect of economic stimulus is absent, as consumers and businesses are reluctant to engage in spending or investing.

The Trade that Highlighted the Trap

Looking back, several years ago, I found myself immersed in a trade that starkly highlighted the dynamics of a liquidity trap. During that time, central banks worldwide were aggressively reducing interest rates, a strategy aimed at stimulating economic activity. It was expected that these conditions would lead to a flurry of economic engagement and revitalization. However, contrary to the anticipated result, the economic boost that lower interest rates were supposed to bring did not come to fruition.

As part of my investment strategy during this period, I operated under the assumption that reduced interest rates would act as a catalyst for business investments and consumer spending, thereby improving company earnings and driving up stock prices. Nonetheless, the unfolding reality was quite different.

The Reality of Consumer Behavior

Instead of the increased financial activity I expected, it became evident that both businesses and consumers were opting to cling to their cash reserves. This behavioral tendency can largely be attributed to prevailing uncertainty regarding the future economic landscape. This uncertainty instilled a precautionary savings mindset among both businesses and individuals. As a result, neither group was inclined to commit to increased spending or investment. Even as money was readily available to borrow at low rates, the expected hike in demand for investments did not come to pass, leaving the economy in a state of stagnation.

Policy Implications

From the standpoint of policy-making, encountering a liquidity trap introduces a set of formidable challenges. The conventional tools — primarily interest rate adjustments — lose their traditionally reliable effectiveness. Consequently, policymakers might need to pivot toward alternative strategies, which often involve fiscal policy interventions as opposed to purely monetary solutions. For instance, government spending could be increased or tax policies adjusted to stimulate demand more directly. Understanding these intricate dynamics is crucial to devising strategies that could help bypass similar economic pitfalls in the future.

Lessons Learned

This trade experience turned out to be an invaluable lesson highlighting the significance of understanding broader economic conditions. It became clear that relying solely on interest rate movements to predict market behavior and economic trajectories is an oversimplification. In addition to monitoring interest rates, it’s imperative to gauge overall economic sentiment and understand the behavior of market participants, as these elements have substantial impacts. Recognizing the early signs of a liquidity trap can lead to more informed investment decisions and help in setting realistic expectations regarding economic recovery trajectories.

Further Exploration

For those who wish to explore the mechanics and implications of liquidity traps more deeply, there is a wealth of economic literature that delves into this subject matter. Many renowned economic publications and institutions offer insights into this phenomenon, often enriched with historical examples and case studies. A pragmatic starting point for in-depth exploration would be perusing analyses provided by reputable financial institutions or economic think tanks. These resources frequently deliver valuable perspectives that deepen the understanding of liquidity traps, offering both theoretical and applied insights that can inform better strategies and decisions in the realm of finance and economics.