Understanding R-Multiples in Trading
R-Multiples are a structured method for evaluating trade performance using a standardized unit of risk. Instead of measuring results solely in monetary terms, traders assess outcomes relative to the initial risk taken on each trade. This framework provides analytical clarity because it focuses on consistency and proportionality rather than fluctuating position sizes or account balances. By reducing each trade to a multiple of its predefined risk, traders can more accurately compare outcomes across different instruments, timeframes, and strategies.
At its foundation, an R-Multiple is built on the concept of initial risk, commonly abbreviated as R. Initial risk is typically defined as the distance between the entry price and the stop-loss level, expressed in monetary terms. Before entering a trade, a trader decides how much capital they are prepared to lose if the trade does not perform as expected. That amount becomes 1R. All subsequent performance metrics are derived from this baseline unit.
This approach shifts attention from gross profit and loss figures to proportional outcomes. A gain of $1,000 may represent a strong result in one context and a modest one in another, depending on the capital at risk. R-Multiples eliminate this ambiguity by presenting outcomes as standardized units. This makes the method especially useful for traders managing accounts of varying sizes or adjusting position sizing strategies over time.
Defining Initial Risk and Trade Structure
The accurate calculation of R-Multiples depends on clearly defining initial risk before trade execution. This process begins with identifying a logical stop-loss level based on the trading strategy. The stop-loss represents the price point at which the trade premise is invalidated. Once this level is established, the trader calculates the difference between the entry price and the stop-loss price. That price difference, multiplied by position size, determines the monetary risk.
For example, assume a trader purchases a stock at $50 with a stop-loss at $48. If the trader buys 200 shares, the risk per share is $2. The total initial risk is therefore $400. This $400 becomes 1R. Regardless of whether the trade ultimately gains or loses money, its result will be expressed relative to this $400 benchmark.
Defining risk in advance introduces procedural discipline. Traders must determine invalidation levels before exposure to market fluctuations. This structure helps prevent arbitrary adjustments that may distort performance analysis. If risk levels are altered mid-trade without documentation, it becomes difficult to accurately calculate R-Multiples. Consistent application of predefined risk is therefore central to meaningful analysis.
Calculating R-Multiples
The formula for calculating an R-Multiple is straightforward:
R-Multiple = Net Profit or Loss ÷ Initial Risk
If a trader risks $400 and closes the trade with an $800 profit, the outcome is +2R. If the trade closes at a $200 loss, the result is -0.5R. If the stop-loss is hit exactly, the trade stands at -1R. This simple ratio standardizes results in a way that monetary figures alone cannot.
Partial exits and scaling strategies can also be evaluated using R-Multiples. Suppose a trader closes half a position at +1R and lets the remaining half run to +3R. The combined result may average to +2R depending on allocation. As long as all results are measured relative to the original risk, the calculation remains valid.
The use of R-Multiples also accommodates varying position sizes. A trader might risk 1% of account equity on one trade and 0.5% on another. In monetary terms, these risks differ, but in R terms they are unified. Each trade is assessed on the quality of decision-making and execution rather than account scale.
Interpreting Positive and Negative R Outcomes
Positive R-Multiples represent profitable trades measured against initial risk. A +3R outcome indicates that the trader earned three times the amount initially placed at risk. Conversely, negative R-Multiples represent losses. A -1R trade reflects a full stop-out, while a -0.3R trade may indicate an early manual exit before the stop-loss was reached.
The distribution of R outcomes across a series of trades reveals significant information about strategy structure. Some trading strategies produce frequent small gains with occasional large losses, resulting in many small positive R values and sporadic negative outliers. Other strategies generate frequent small losses offset by periodic large winners, reflected as multiple -1R results combined with occasional +4R or +5R trades.
Examining these distributions provides insight into expectancy, which is the average R per trade over time. A strategy that yields an average of +0.5R per trade across a sufficiently large sample has a statistical edge, even if the win rate is below 50 percent. Expressing expectancy in R terms keeps evaluation consistent across account growth phases.
R-Multiples and Risk-Reward Ratios
Risk-reward ratios are closely related to R-Multiples. A predefined target of +2R implies that the trader aims to earn twice the initial risk. However, R-Multiples provide more than projected ratios; they record what actually occurred. While a setup may target 3R, actual market behavior might produce 1.7R or 4.2R depending on exit management.
Tracking realized R-Multiples allows traders to compare expected risk-reward parameters with real outcomes. If the average winning trade consistently falls short of intended targets, adjustments may be required in exit planning or trade selection criteria. Conversely, if winners frequently exceed projected levels, it may indicate effective trend participation.
The distinction between planned and realized R is important. Trading plans define entry, stop-loss, and target levels in advance. R-Multiple analysis measures the effectiveness of execution relative to those original assumptions.
Standardization Across Markets and Strategies
One advantage of R-Multiples is their adaptability across asset classes. Whether trading equities, futures, foreign exchange, or digital assets, the principle remains constant: risk is defined first, and performance is measured relative to it. Volatility differences between markets do not distort evaluation when outcomes are expressed in R terms.
This standardization also facilitates comparison between trading strategies. A swing trading system on daily charts and an intraday momentum approach may produce very different dollar results. However, if both are evaluated using average R per trade, win rate, and distribution of R outcomes, their structural strengths and weaknesses become comparable on neutral terms.
Professional portfolio managers may apply similar logic when allocating capital among multiple strategies. By examining historical R distributions, they can assess which systems demonstrate consistent positive expectancy and controlled downside variance.
Benefits of Using R-Multiples
One primary benefit of R-Multiples lies in performance transparency. Monetary gains can mask inconsistent risk practices. A trader may report profitability over a period while occasionally taking disproportionately large risks. Measuring results exclusively in R terms highlights deviations from predefined exposure limits.
Another benefit involves psychological neutrality. Thinking in terms of R rather than dollars reduces the emphasis on monetary magnitude. This perspective supports consistent decision-making by shifting focus toward process quality. When each trade is evaluated as a multiple of risk, the trader’s objective becomes executing setups correctly rather than targeting specific dollar amounts.
R-Multiples also support statistical analysis. Over a sufficiently large sample of trades, it becomes possible to calculate metrics such as average R, median R, standard deviation of R outcomes, and maximum drawdown in R terms. These statistics provide insight into system stability without requiring adjustments for account size changes.
Additionally, R-based tracking simplifies performance scaling. If a trader increases position size while maintaining constant percentage risk, historical R data remains relevant. The expectancy expressed in R continues to reflect strategy performance regardless of capital growth.
Expectancy and Long-Term Performance
Expectancy is a central concept in trading analysis and is closely linked to R-Multiples. It can be calculated as:
Expectancy = (Average Win in R × Win Rate) − (Average Loss in R × Loss Rate)
For example, if a strategy has a 40 percent win rate with an average winner of +3R and an average loser of -1R, expectancy equals:
(3 × 0.4) − (1 × 0.6) = 1.2 − 0.6 = +0.6R per trade.
This means that, on average, each trade generates 0.6R. Over 100 trades, the projected net outcome would be approximately +60R, subject to variance. Expressing expectancy in R clarifies whether a trading system has a mathematical edge independent of account size.
Monitoring expectancy over rolling samples can reveal performance shifts. A declining average R may indicate changing market conditions or weakening strategy effectiveness. Early identification of these changes enables structured review rather than reactive decision-making.
Drawdowns Measured in R
Drawdowns are typically measured in percentage or monetary terms, yet evaluating them in R provides additional insight. A drawdown of -10R indicates that the trader has lost ten times the predefined risk unit across a series of trades. If the standard risk per trade is 1 percent of equity, this would approximate a 10 percent decline, though compounding effects may cause slight variation.
Assessing drawdowns in R helps determine whether losses fall within historical norms. If prior testing indicated that the strategy’s worst historical drawdown was -15R, experiencing -8R may not signal structural failure. However, exceeding established R-based risk thresholds may suggest the need for reassessment.
This framework also assists in setting risk-of-ruin parameters. By understanding typical negative streaks in R terms, traders can determine appropriate capital allocation that preserves long-term viability.
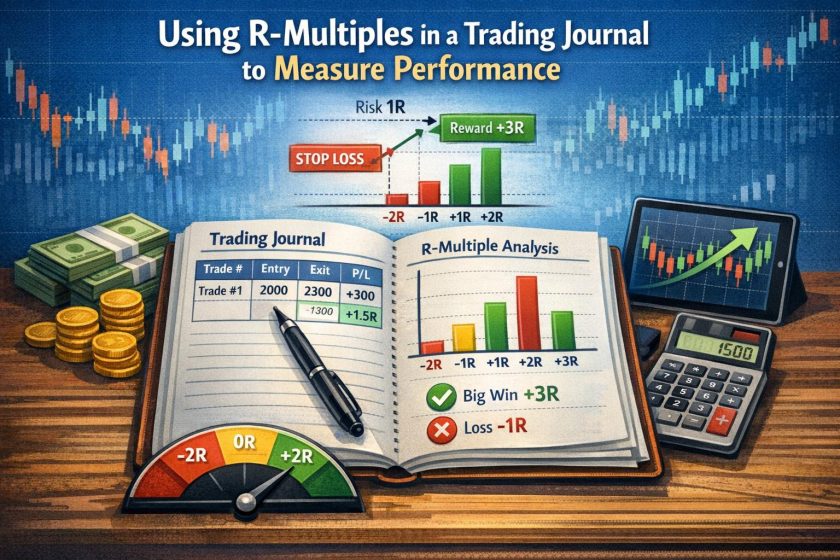
Integrating R-Multiples into a Trading Journal
Incorporating R-Multiples into a trading journal requires systematic documentation. Each recorded trade should include entry price, stop-loss level, target levels if applicable, position size, and resulting exit price. From these values, initial risk and final R outcome are calculated.
Maintaining accurate records enables aggregate analysis. Over time, traders can sort results by setup type, market condition, timeframe, or instrument and compare average R values across categories. Patterns may emerge indicating that certain environments produce stronger R performance than others.
It is also useful to record planned R targets alongside realized R results. Deviations between planned and actual outcomes may highlight issues in execution discipline. For example, consistently accepting profits below 1R when the plan targets 2R could materially reduce overall expectancy.
Some traders supplement numerical records with brief qualitative notes. Observations regarding market structure, volatility context, or adherence to rules can help interpret variations in R performance. The aim is not to replace quantitative measurement but to provide structured context for review.
Position Sizing and R Consistency
R-Multiples are most effective when combined with consistent position sizing rules. Many traders risk a fixed percentage of equity per trade, such as 1 percent. In this case, 1R always corresponds to that fixed percentage, even as account size fluctuates. This method creates natural compounding during profitable phases and automatic contraction during drawdowns.
If position sizing varies widely without a structured basis, R analysis can become distorted. For example, risking 0.5 percent on one trade and 3 percent on another changes the practical impact of each R outcome. Therefore, consistent exposure policies are necessary for meaningful comparisons.
Advanced traders may adjust R dynamically according to volatility or correlation across positions. In such cases, careful documentation ensures that each R still represents a clearly defined and controlled unit of risk.
Common Misinterpretations of R-Multiples
Although R-Multiples provide clarity, they can be misinterpreted if applied inconsistently. One common issue involves redefining risk after entry. If a trader moves a stop-loss further away without formally adjusting the original R calculation, reported results will not accurately reflect true exposure.
Another issue arises when traders focus solely on large positive R outcomes without considering frequency and distribution. A single +10R trade may significantly influence average results, but if accompanied by numerous -1R losses, the overall expectancy may remain modest or unstable.
Additionally, R-Multiples do not replace broader risk management considerations such as portfolio diversification, liquidity constraints, and market regime changes. They function as a measurement tool within a comprehensive trading framework.
Further Development and Study
Traders seeking to deepen their understanding of R-Multiples can incorporate statistical backtesting, forward performance tracking, and scenario analysis. By evaluating historical data in R terms, it becomes possible to simulate potential drawdowns and estimate long-term distribution behavior.
Educational materials covering risk management, position sizing models, and performance analytics often discuss R-based frameworks in detail. Structured study combined with consistent journaling enhances comprehension and practical application. Participation in professional discussions can also expose traders to alternative interpretations and refinements of the R concept.
As experience accumulates, many traders find that thinking in R becomes intuitive. Trade planning, execution, and review all operate within the same unit of measurement. This integration supports coherence between strategy design and performance evaluation.
Incorporating R-Multiples into a trading journal provides a systematic method to measure outcomes relative to predefined risk. By focusing on standardized risk units rather than fluctuating monetary amounts, traders gain clearer insight into expectancy, drawdowns, and strategic consistency. When applied with disciplined position sizing and accurate record-keeping, R-Multiples form a practical foundation for objective trade analysis and long-term performance assessment.