Introduction to Trade Tagging
In trading, maintaining a detailed journal is one of the most practical methods for evaluating performance and refining decision-making. While recording entry and exit points is useful, raw trade logs alone often fail to explain why specific outcomes occurred. Trade tagging introduces structure into the journaling process by assigning descriptive labels to trades based on predefined criteria. These labels transform a simple record into an analytical dataset.
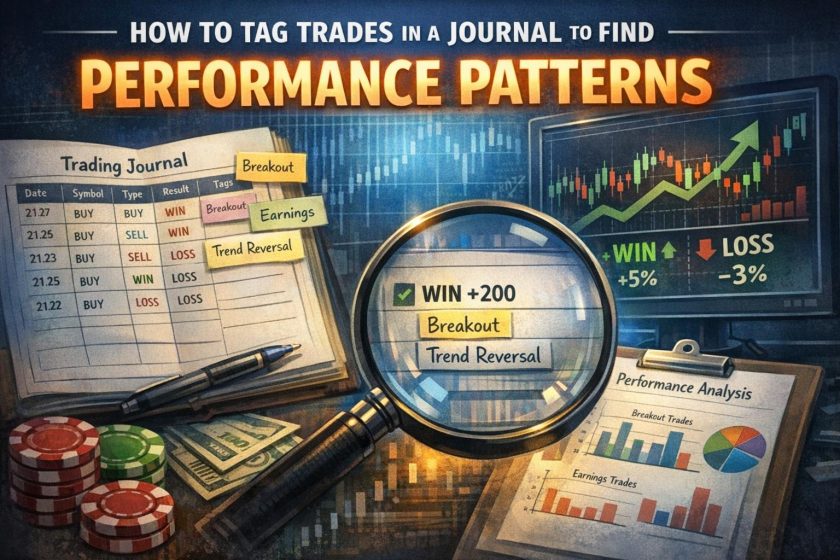
Trade tagging is the practice of categorizing trades according to characteristics such as setup type, market environment, time of execution, risk profile, or psychological state. Instead of reviewing trades individually, traders can group similar trades and analyze them collectively. This systematic approach improves clarity when assessing performance and helps isolate variables that influence results.
Without a tagging framework, traders may rely on memory or subjective impressions to evaluate performance. Structured tagging reduces this subjectivity and makes performance measurement more data-driven. Over time, a tagged journal becomes a structured database capable of supporting meaningful statistical conclusions.
Why Tagging Is Important
Tagging trades provides a comprehensive overview of trading behavior. It enables traders to classify performance across multiple dimensions rather than evaluating outcomes in isolation. A winning trade does not necessarily indicate strong execution, and a losing trade does not automatically signal a flawed strategy. Tags add context that clarifies what actually occurred.
For example, a trader may discover that breakout trades perform consistently in trending markets but underperform in sideways conditions. Without tagged data, this distinction might remain unnoticed. By categorizing trades by market condition and setup type, these performance differences become measurable.
Tagging also strengthens accountability. When traders record aspects such as rule adherence or deviations from strategy, patterns of discipline emerge. This creates a clearer picture of behavioral tendencies and encourages structured improvement. Over time, tagged records allow for more precise adjustments to trading plans.
Additionally, tagging supports risk management review. By labeling trades according to risk size, volatility conditions, or account exposure, traders can evaluate how risk allocation correlates with long-term outcomes. This is especially relevant when scaling strategies or adjusting position sizing models.
Basic Principles of Trade Tagging
An effective tagging system is built upon clarity and structure. Without defined standards, tags can become inconsistent and unreliable, which undermines analysis.
Consistency: Traders should establish a standardized list of tags and definitions before applying them. If one trade is labeled “Breakout” and another similar trade is labeled “Range Break,” inconsistencies can distort performance comparisons. Written definitions help eliminate ambiguity and ensure that tags are applied uniformly over time.
Relevance: Every tag should serve a specific analytical purpose. Adding excessive or redundant labels complicates evaluation and reduces clarity. For instance, if a trader does not use volume analysis in decision-making, tagging volume spikes may add unnecessary complexity.
Simplicity: A tagging system does not need to be overly complex to be effective. Beginning with a manageable number of categories ensures accuracy and sustainability. Additional layers can be introduced gradually as analysis requirements evolve.
Objectivity: Tags should describe observable conditions rather than subjective interpretations. Instead of labeling a trade as “Good Idea,” it is more useful to label it according to quantifiable criteria such as “Pullback to 20 MA in Uptrend.”
Clear documentation of tagging criteria helps maintain statistical integrity in long-term analysis.
Common Tag Categories
Organizing trades into logical categories allows for structured comparison. Several widely used categories form the foundation of many trading journals.
Market Conditions: Market context significantly affects performance. Tagging trades as occurring in bull markets, bear markets, high-volatility environments, low-volatility conditions, or range-bound periods helps identify where a strategy performs best. Traders who operate in multiple asset classes may also distinguish between equities, futures, forex, or digital assets.
Trade Setups: Setup classification is fundamental to strategy evaluation. Tags such as breakout, pullback, mean reversion, trend continuation, range rejection, or news reaction identify the underlying strategy logic. Over time, traders can calculate metrics such as win rate, average return, and drawdown per setup type.
Psychological State: Emotional context influences execution. Tags indicating conditions such as calm, distracted, fatigued, overconfident, or hesitant provide measurable insight into behavioral consistency. When psychological tags are analyzed alongside results, traders may identify correlations between mental state and performance.
Execution Quality: Trades can be tagged according to adherence to plan. Designations such as “Rule-Followed,” “Early Entry,” “Late Entry,” or “Improper Stop Placement” help distinguish performance due to strategy effectiveness from performance affected by execution errors.
Trade Duration: Distinguishing between scalps, intraday trades, swing trades, and position trades clarifies how time horizon influences results. This is valuable for traders experimenting with multiple timeframes.
Structured categories allow performance reports to move beyond simple profit and loss summaries toward more meaningful insights.
Advanced Tagging Techniques
As a trader’s analytical framework matures, additional layers of tagging can refine insight.
Time-Based Tags: Performance can vary significantly depending on execution timing. Tags such as pre-market, market open, midday session, closing hour, or overnight hold enable traders to isolate time-of-day effects. Some traders discover that volatility during the first trading hour aligns more effectively with breakout strategies, while quieter midday sessions suit mean reversion approaches.
Risk Level: Trades may be labeled as low, medium, or high risk based on position size relative to account equity or based on stop-loss distance. Analyzing performance by risk classification can reveal whether higher risk exposure produces proportionally higher returns or merely increases drawdown volatility.
Technical Indicators: For traders who rely on technical analysis, tagging which indicators informed the decision allows performance evaluation of those tools. Examples include moving averages, RSI divergences, MACD crossovers, Fibonacci retracements, or volume confirmation. This analysis may demonstrate that certain indicators perform better in trending environments compared with consolidating markets.
Fundamental Catalysts: In markets influenced by earnings, economic reports, or macro events, traders may tag trades tied to specific catalysts. This distinction can reveal whether event-driven trades outperform technically driven ones.
Environmental Conditions: Broader contextual tags may include liquidity level, volatility index readings, or correlation with major indices. These environmental layers deepen understanding of system robustness.
Advanced techniques are most effective when built upon a stable foundational tagging structure. Complexity should increase only when data analysis demands it.
Analyzing Tagged Data
Tagging alone does not improve performance; the analytical process that follows creates value. Once trades are categorized consistently, statistical evaluation becomes possible. Data can be exported to spreadsheets or specialized journaling software for analysis.
Metrics such as win rate, expectancy, average risk-to-reward ratio, maximum drawdown, and profit factor can be calculated per tag category. Comparing these metrics across categories reveals areas of strength and weakness.
For example, suppose breakout trades in high-volatility environments produce a positive expectancy while pullback trades during low volatility show negative expectancy. The trader can then consider shifting focus toward favorable conditions rather than applying strategies uniformly across all environments.
Visual representation of tagged data strengthens clarity. Pie charts showing trade distribution by setup, bar graphs comparing average returns, or line charts illustrating equity curves per category make trends easier to interpret.
Longitudinal analysis is equally important. Quarterly or annual reviews of tagged performance help identify whether edge sustainability is improving or deteriorating over time. Market conditions evolve, and tagged data can detect shifts in strategy viability.
Drawing Insights from Data
Comprehensive analysis transforms raw data into actionable information. Several forms of insight typically emerge from structured review.
Pattern Recognition: When trades are grouped by shared attributes, patterns become visible. A trader might discover that breakout setups succeed only when aligned with higher timeframe trends. Alternatively, mean-reversion trades may perform consistently during range-bound market phases.
Strategy Refinement: Tagged performance enables precise adjustments. Instead of discarding an entire strategy after a series of losses, traders can isolate the exact context that contributed to underperformance. Adjustments may involve filtering trades by volatility thresholds, limiting exposure during specific sessions, or modifying entry timing.
Behavioral Adjustment: Emotional and execution tags often reveal recurring discipline challenges. For example, late entries due to hesitation may show reduced profitability compared with rule-followed executions. Recognizing this allows traders to develop targeted corrective measures.
Risk Calibration: Reviewing performance by risk classification may indicate that higher risk allocation does not proportionally increase returns. Position sizing formulas can then be recalibrated for improved stability.
Over time, these incremental improvements compound, leading to a more refined and data-informed trading approach.
Integrating Tagging Into Daily Practice
Consistency in journaling determines effectiveness. Traders should record tags immediately after closing trades to ensure accuracy. Delayed tagging can lead to memory distortions or incomplete context.
Automation can simplify the process. Many platforms allow custom tagging fields or dropdown selections, reducing manual effort. Where automation is unavailable, predefined templates in spreadsheets maintain structure.
Periodic review sessions should be scheduled. Weekly evaluations allow for immediate adjustments, while monthly or quarterly reviews provide broader statistical insight. During these reviews, traders can compare performance across tags, assess compliance with strategy rules, and consider refinements.
Documentation of tagging criteria should evolve cautiously. Modifying tag definitions frequently disrupts long-term comparisons. If adjustments are required, they should be recorded clearly so historical data remains interpretable.
Limitations and Considerations
While tagging enhances analysis, it does not eliminate uncertainty inherent in trading. Statistical significance requires an adequate sample size. Drawing firm conclusions from a limited dataset can produce misleading interpretations.
Confirmation bias is another consideration. Traders may focus selectively on tags that confirm prior beliefs. Objective statistical review helps mitigate this tendency.
Additionally, over-segmentation of data can reduce clarity. Dividing trades into too many narrow categories may result in insufficient sample sizes per tag, limiting meaningful analysis. Balance between granularity and statistical power is essential.
Trade tagging should also complement, not replace, broader performance evaluation metrics. Equity curves, drawdown statistics, and risk-adjusted return measures remain vital components of assessment.
Conclusion
Tagging trades within a journal provides a structured framework for systematic performance analysis. By categorizing trades according to relevant criteria and maintaining consistent definitions, traders create a dataset capable of supporting meaningful statistical evaluation.
Through disciplined analysis of tagged data, patterns become measurable rather than anecdotal. Strategies can be refined with precision, behavioral tendencies can be addressed constructively, and risk management can be calibrated according to evidence rather than assumption.
Over time, a well-maintained tagged journal evolves into a detailed performance archive. It transforms individual trades from isolated events into components of a broader analytical system. By applying structured tagging principles and conducting regular reviews, traders position themselves to make progressively informed decisions grounded in organized data rather than subjective memory.